
On Thursday, the Congressional Budget Office (CBO) wrapped its weeks-long work on a full score for the House’s version of the Build Back Better Act, measuring the combined spending, tax, and deficit impacts of the legislation over a 10-year window. Hours later, House Democrats took a party-line vote to advance the bill to the Senate, with only Rep. Jared Golden (D-ME) joining all Republicans in opposition.
Here are a few interesting takeaways from the CBO score. All graphics are produced by NTU, based on data from CBO.
The Bill Is Not Paid For, and Would Increase Deficits Over 10 Years
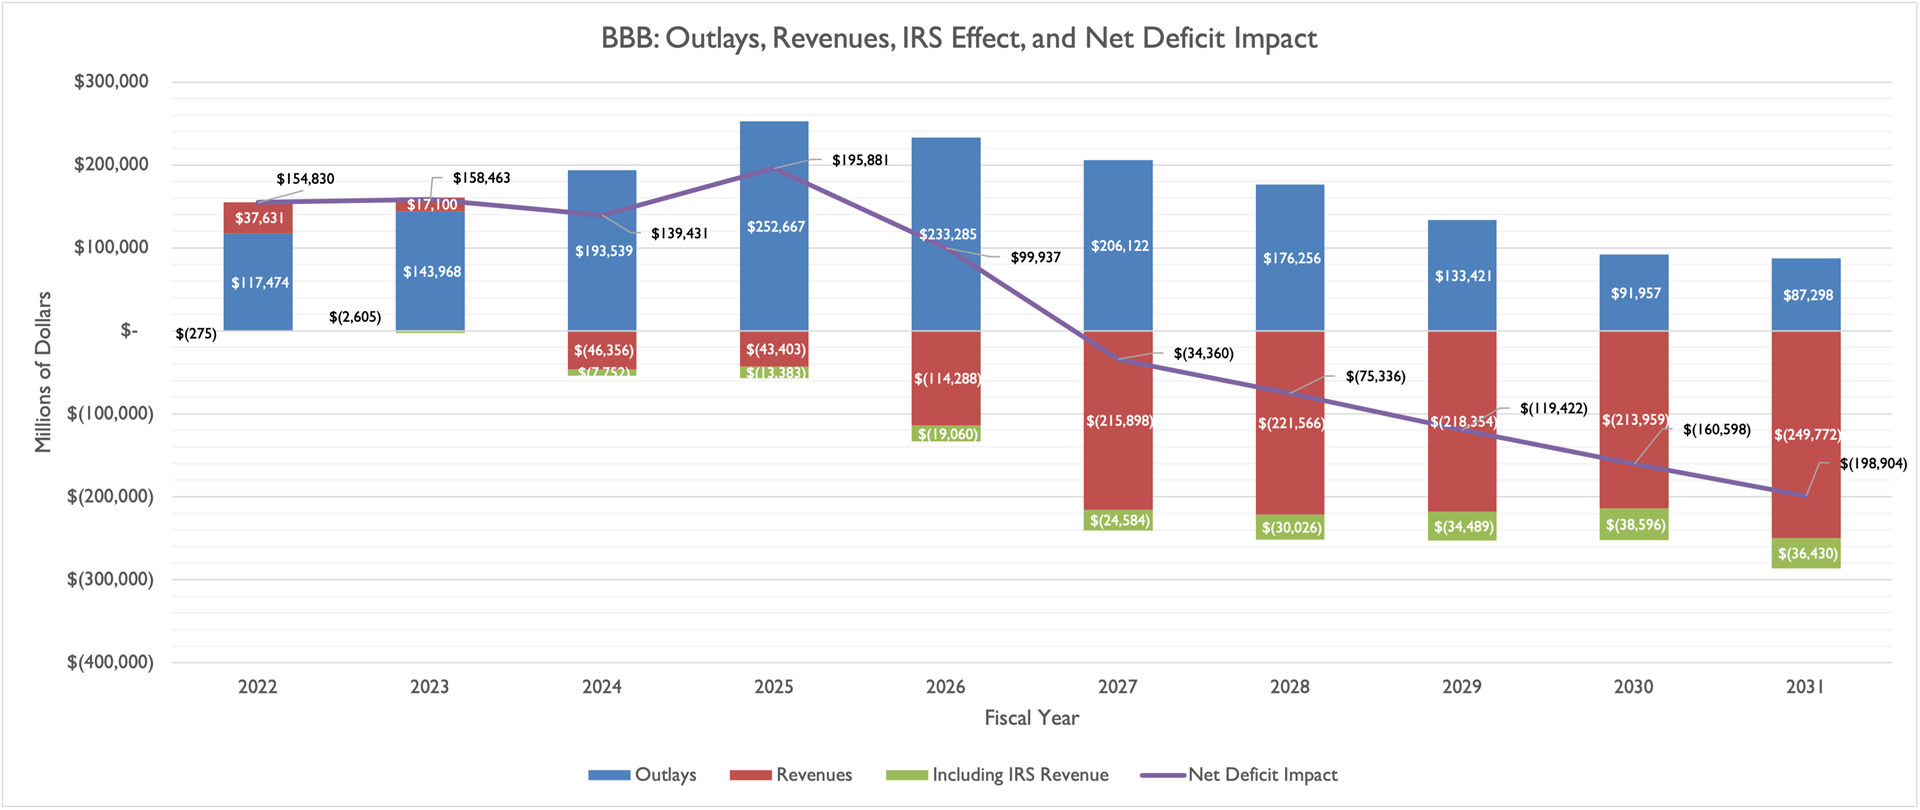
CBO found that the Build Back Better Act would increase deficits by about $367 billion on net over 10 years, but that estimate does not account for projected revenues from increased Internal Revenue Service (IRS) enforcement of tax laws. Democrats are giving the IRS a big budget boost, ostensibly to reduce the gap between taxes owed and taxes paid, but CBO scoring conventions prevent the agency from counting increased revenue from IRS enforcement in the official score. Doing so on an unofficial basis, as NTU does in the chart above, reduces the deficit impact of Build Back Better to $160 billion over 10 years -- still no small number.
Importantly, the chart above demonstrates that Build Back Better increases deficits by hundreds of billions of dollars in the first five years (fiscal years 2022-26), before decreasing deficits in the second half of the decade (FYs 2027-31).
Unfortunately, history tells us that Congress is really talented at eating their proverbial dessert (i.e., increasing spending, reducing taxes, and increasing deficits) and does a really, really poor job at eating their proverbial vegetables (i.e., cutting spending, increasing taxes, and decreasing deficits). Just look to the Bush-era tax cuts, the Affordable Care Act, and the Budget Control Act as examples.
If future Congresses keep up the spending in Build Back Better -- which is subject to gimmicky cliffs right now that cause programs to expire after four years or even one year -- and roll back some of the revenue raisers, the bill would increase the deficit much more than $160 billion over the 10-year window.
Business Tax Hikes Do the Heavy Lifting
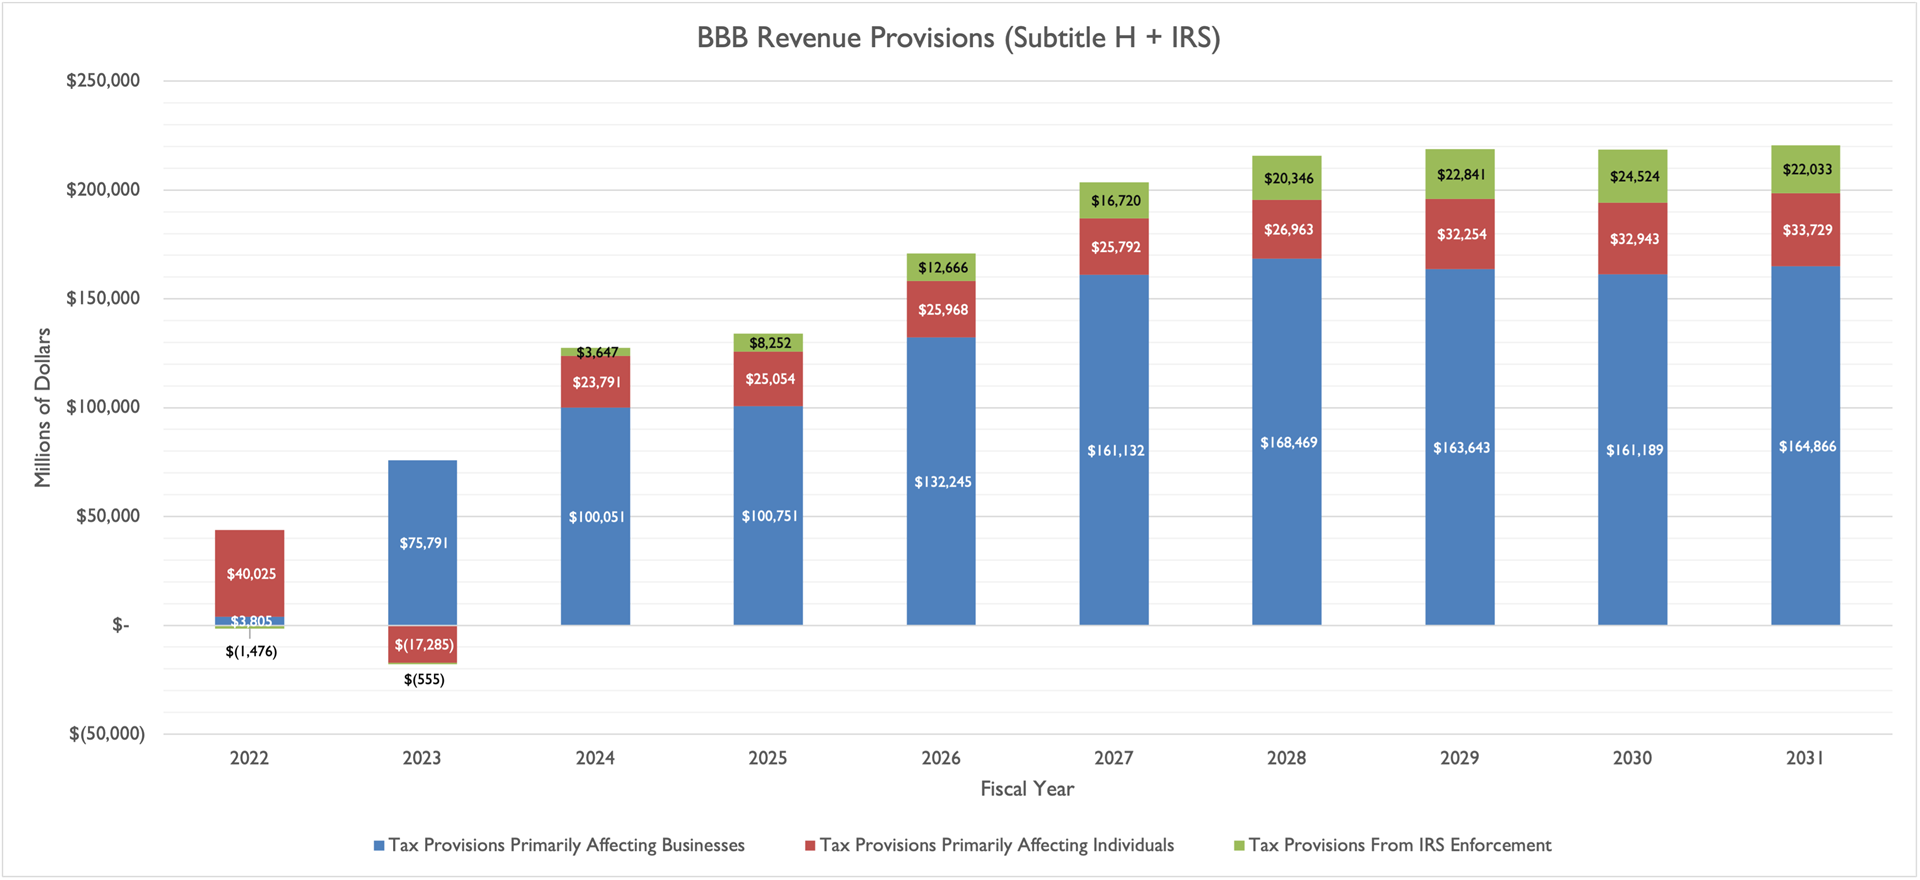
Of the hundreds of billions of dollars House Democrats have proposed in tax increases to pay for their new spending, tax increases on businesses make up the bulk of revenue raisers. For the chart above, NTU included two tax increases on so-called pass-through businesses that are technically on the individual side of the tax code (since these businesses, such as S corps, LLCs, and sole proprietorships, ‘pass’ income through to the individual owners’ tax returns). While these tax increases (applying a net investment income surtax from the ACA to the business income of high-income individuals, and limiting how individuals can apply net business losses to their tax bill) have a statutory incidence on the individual business owners responsible for paying the tax, they have an economic impact on workers and would-be workers at those businesses.[1]
While some lawmakers claim these business taxes are about making ‘wealthy corporations pay their fair share,’ economists at the Joint Committee on Taxation and the Congressional Budget Office, and the Treasury Department have assigned somewhere between 18 percent and 25 percent of the corporate tax burden to workers, rather than just shareholders.
In other words, with hundreds of billions of dollars of tax increases affecting businesses in Build Back Better ($1.23 trillion over 10 years in the chart above, per CBO data), we can reasonably expect tens of billions of dollars or possibly hundreds of billions of dollars within those tax hikes to fall on American workers.
The Tax Foundation has estimated that, in large part due to these tax increases, Build Back Better would reduce wages by nearly 0.3 percent over time, reduce the size of the economy (as measured by long-run GDP) by nearly 0.4 percent, and could lead to 107,000 fewer full-time equivalent (FTE) jobs. The most damaging single tax provisions, according to Tax Foundation, are the 15-percent book minimum tax (which NTU wrote about here) and the surcharge on high-income individuals.
Major Pay-Fors in BBB Shift Over Time
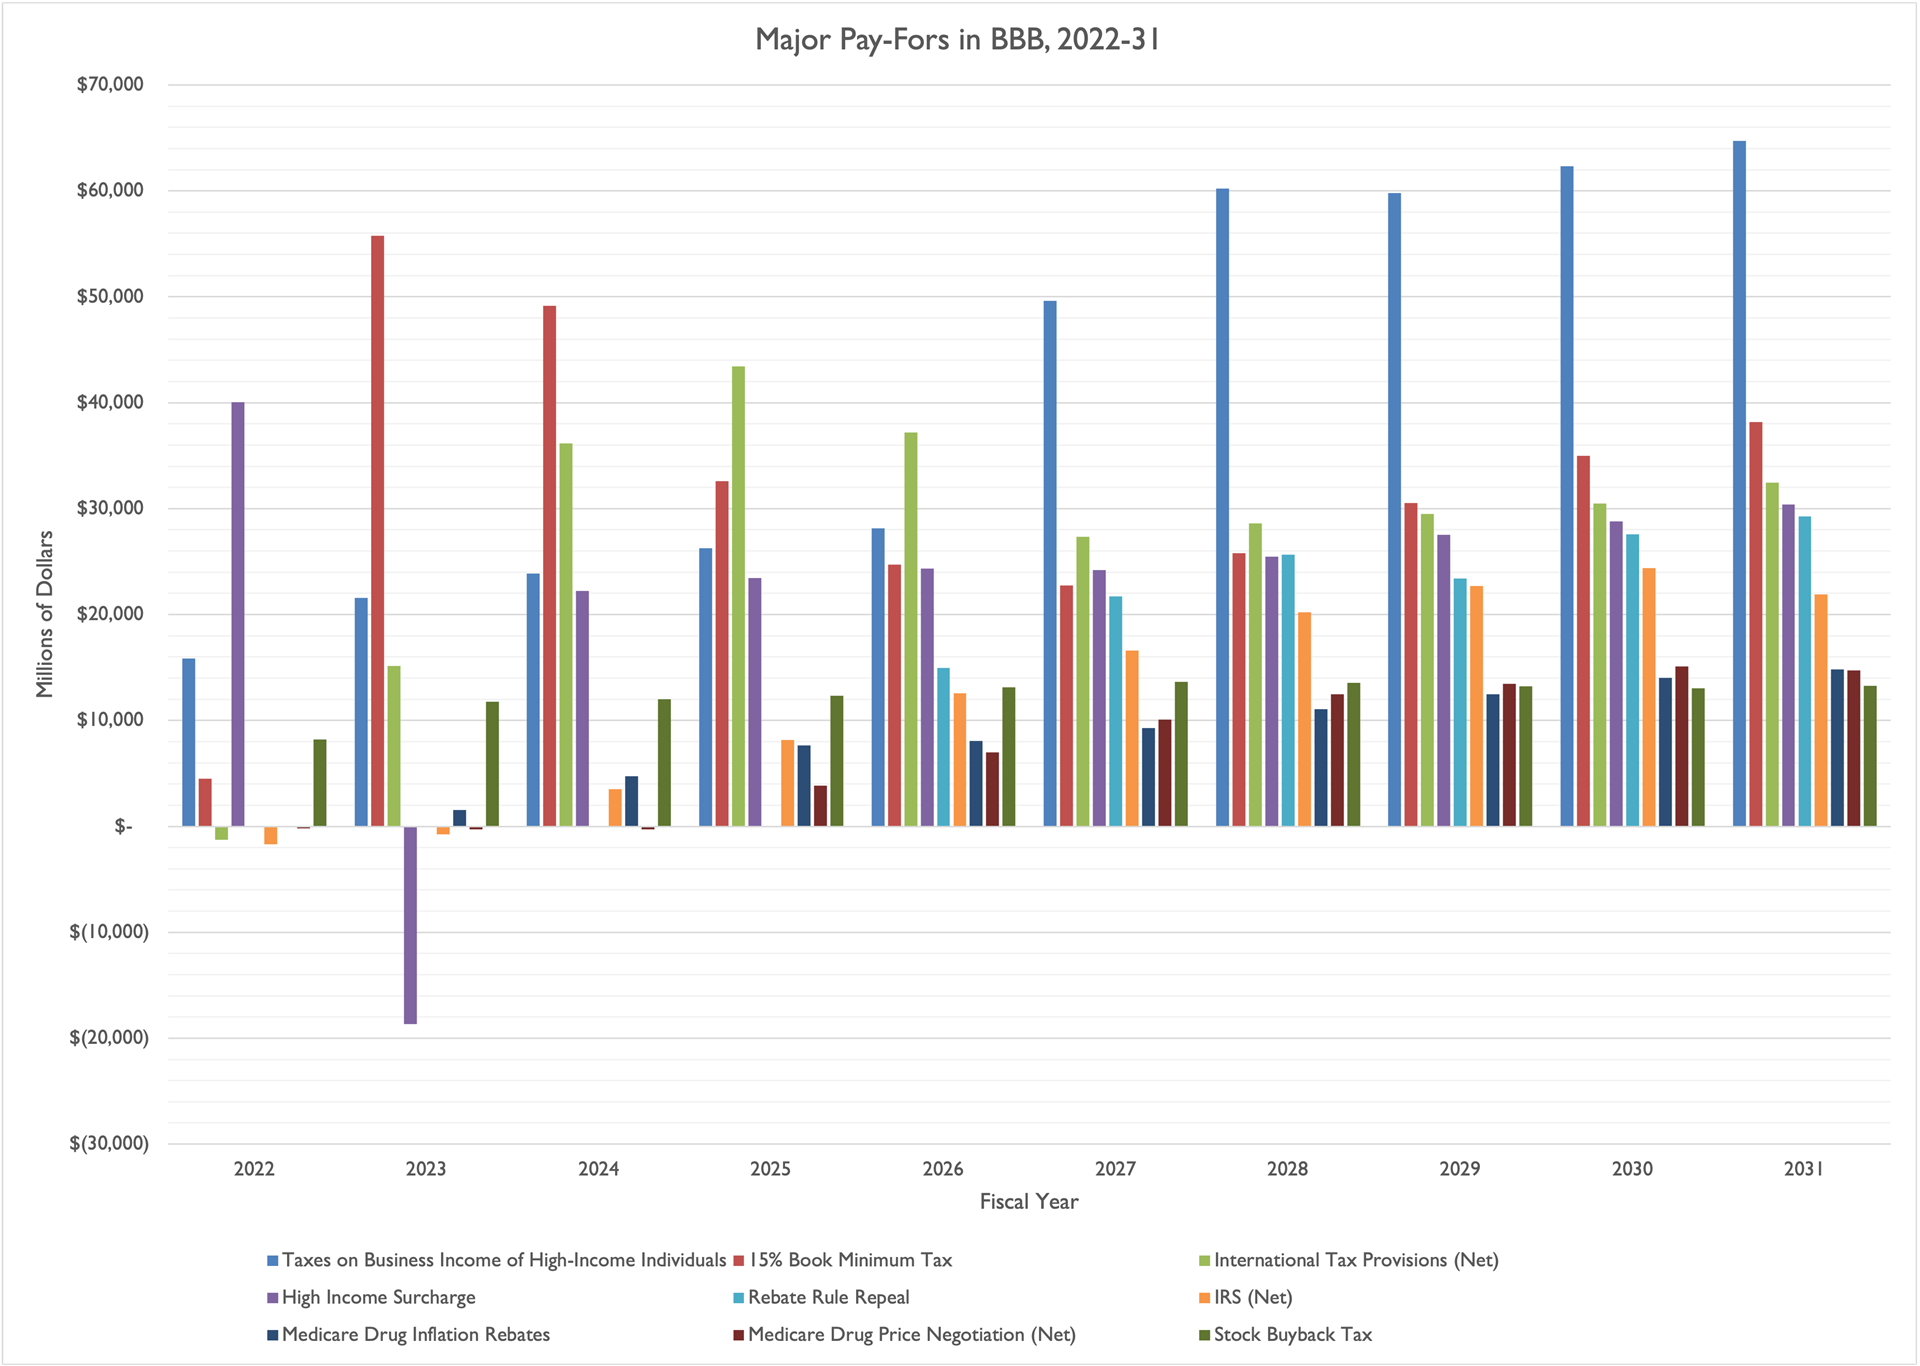
Nine major tax and health provisions in Build Back Better account for most of the pay-fors in the House legislation, over $1.87 trillion combined.[2]
However, due to timing effects, different pay-fors do the ‘heavy lifting’ of attempting to pay for Build Back Better over time:
- In FY 2022, the top pay-for (by a long shot) is the high-income surcharge, but that provision actually loses the federal government revenue in FY 2023, presumably due to high-income taxpayers’ responses to the new tax;
- From FY 2023 through FY 2024, the 15-percent book minimum tax on corporations is the top pay-for, also by a long shot; however, revenues from that provision diminish over time;
- From FY 2025 through FY 2026, the international tax provisions, which don’t go into effect until calendar year 2023, do a plurality of the lifting among BBB pay-fors; however, several outstanding concerns remain about those provisions given a lasting global agreement on minimum taxes for corporations’ foreign earnings is far from certain; and
- From FYs 2027 through 2031, the last five years of the BBB 10-year window, taxes on the business income of high-income individuals raise a plurality of the revenue needed to pay for BBB spending (more than half of which occurs in the first five years, as my NTU Foundation colleague Demian Brady has pointed out).
The rebate rule gimmick (which NTU Foundation’s Brady has also written about) does some pay-for work in the final six years of the 10-year window (about $142.5 billion total), and is the fifth largest pay-for from FYs 2029-31; NTU has argued that the repeal of a rule that was never implemented should not count as a pay-for in any legislation, either the bipartisan infrastructure law or BBB.
Hundreds of Billions for the Wealthy in the First 5 Years
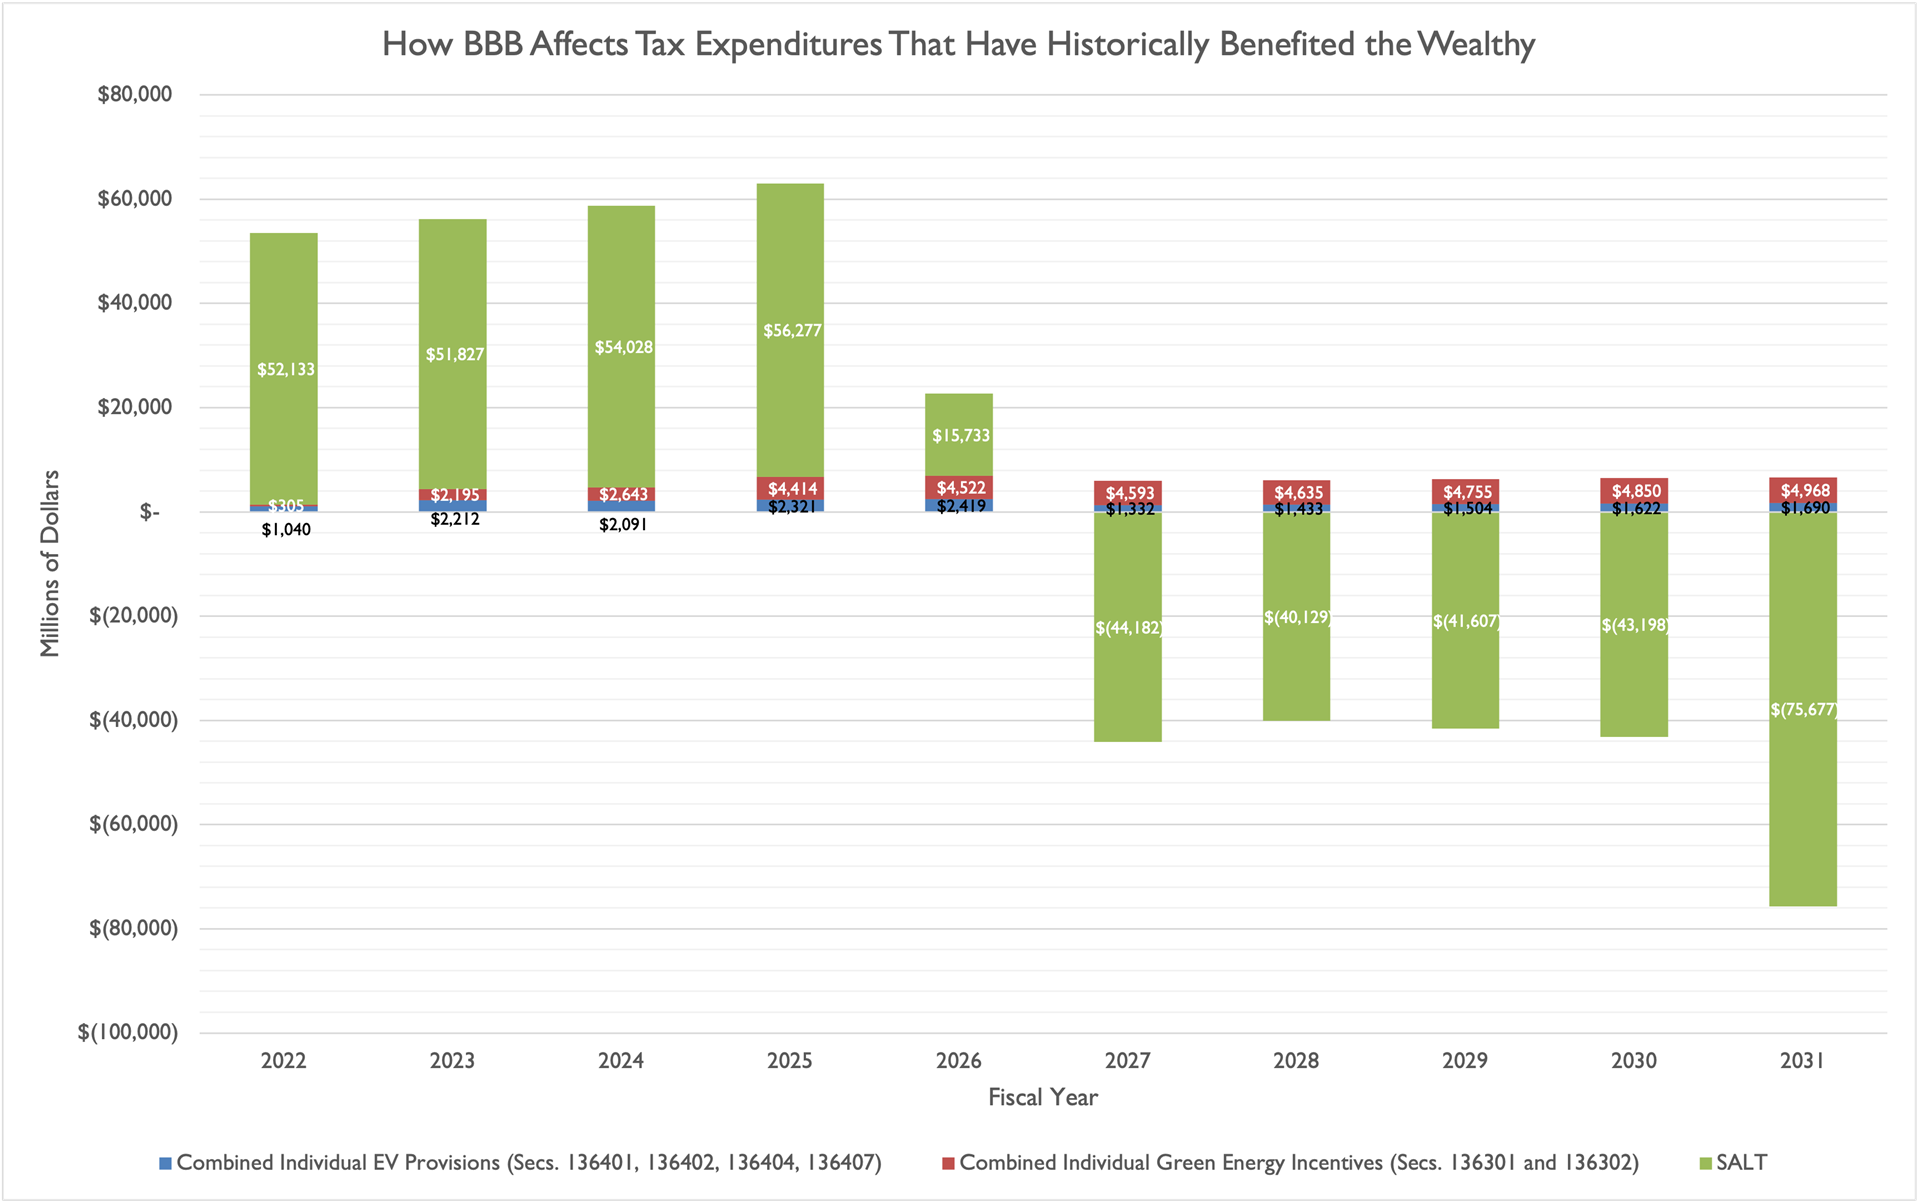
One of the most concerning provisions of BBB for some progressive Democrats -- and some moderate Democrats like Rep. Golden, who voted against the bill -- was raising the cap for state and local tax (SALT) deductions from $10,000 to $80,000. Doing so provides a windfall mostly to wealthy households in the first five years of the 10-year window.
Electric vehicle tax credits and individual energy efficiency incentives that have historically benefited the wealthy add tens of billions more dollars to the BBB package over the 10-year window (about $55.5 billion across six sections of the legislation). There is no guarantee that these incentives would continue to benefit the wealthy, but if historical trends hold up they wouldl.
Ignoring interaction effects and potential taxpayer responses to policy changes, simply eliminating the six green energy incentives from the bill and delaying the $80,000 SALT cap until 2026 (rather than having it kick in for 2021, while keeping the reversion to a $10,000 cap for 2031) could reduce the deficit impact of BBB by somewhere around $300 billion. It would also help Democrats avoid the politically embarrassing point that they are potentially giving wealthy households a $255 billion windfall in the first five years of their BBB plan.
Conclusion
The debate over BBB is far from over -- the legislation heads to the Senate now, where significant changes are likely before the House has to vote again. What the CBO score of the House bill demonstrates, though, is that a lot of work remains to make BBB a deficit-neutral bill, and one that avoids harmful business tax hikes that could negatively impact U.S. workers.
[1] For example, see this analysis from Tax Foundation’s William McBride and Alex Durante: “Raising the top marginal tax rate on pass-through business income reduces the after-tax return on investment for those firms, reducing incentives to invest and hire.”
[2] Some of these provisions -- specifically the international tax provisions, the IRS enforcement provisions, and the Medicare drug price negotiation provisions -- are listed in the chart above for their net effect, not gross revenue raised and/or spending cut. The international tax section includes mostly provisions that raise revenues, and a few that reduce revenues. The IRS enforcement figures reflect the net return estimated by CBO on investments in the IRS budget. The Medicare drug price negotiation section mostly consists of reduced spending on drugs in Medicare, but reflects a relatively small amount of additional spending for Medicare to actually enforce the negotiation provisions.