
In celebration of the House passage of the Build Back Better Act, a top legislative priority for Democrats that spends and raises trillions of tax dollars over the next decade, Speaker Nancy Pelosi wrote to her colleagues that the legislation “forge[s] extraordinary progress for the American people: creating good-paying jobs, lowering costs and cutting taxes” (emphasis ours).
Does Build Back Better cut taxes? For some, yes. For a majority of Americans, the answer may be no, depending on the year and on where those Americans fall along the income spectrum.
This is according to new analysis from the nonpartisan Joint Committee on Taxation (JCT), lawmakers’ tax experts who model the effects proposed legislation would have on taxpayers across the country.
JCT published two analyses last week on Build Back Better. One takes most of the provisions in the Ways and Means Committee’s part of Build Back Better and estimates the change in federal taxes paid by Americans of different income levels from 2022 through 2031. This distributional analysis is one way of determining who bears the burden of new taxes and tax increases in Build Back Better -- and who benefits from the tax cuts in the bill. The second analysis looks at what percentage of taxpayers at different income levels will see either a major tax decrease, a major tax increase, or small/no changes to their tax bill due to Build Back Better.
What do these analyses tell us? Here are a few takeaways.
Timing Effects of CTC, SALT, and More Make 2022 an Outlier Year
(Note: If you're reading this on a mobile device, consider tilting your phone horizontally for the best experience viewing this graphics.)
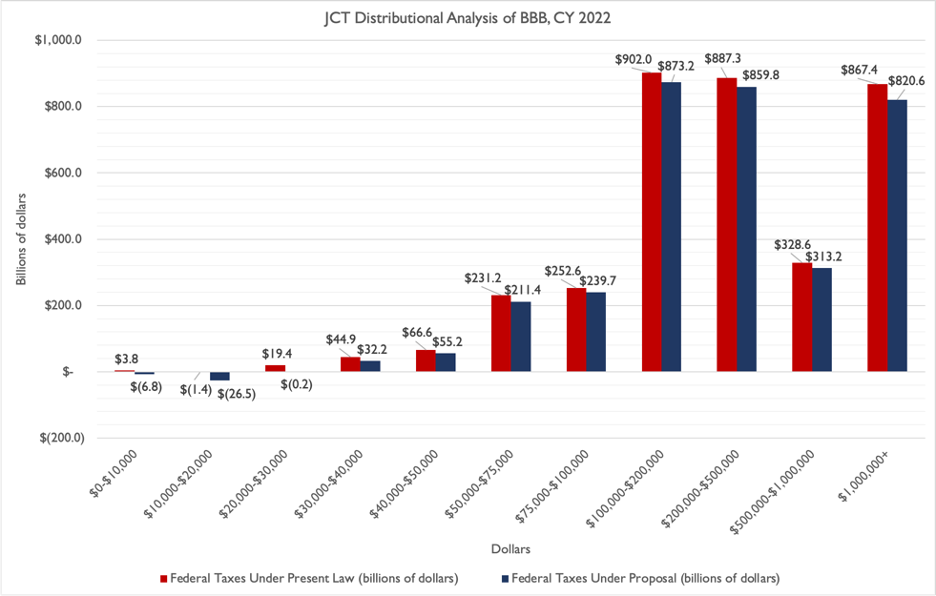
Of the 11 income ranges examined by JCT, each one sees a decrease in their federal taxes for calendar year 2022 under Build Back Better. The largest nominal tax decrease is for taxpayers making over $1 million per year, who see a $46.8 billion decrease in tax liabilities in 2022 alone. (Note, however, that although tax liabilities for taxpayers making more than $1 million per year decrease in 2022, the average tax rate for those taxpayers increases by a few percentage points, from 29.9 percent to 33.1 percent; former Ways and Means Committee economist Don Schnedier has good explanations of this phenomenon here and here.)
The largest proportional decrease in tax liability, however, would go to taxpayers making less than $10,000 per year. Their tax liabilities would fall by $10.6 billion, from $3.8 billion under present law to -$6.8 billion under the legislation. This negative tax liability is likely due in large part to refundable tax credits, such as the Child Tax Credit (CTC) and the Earned Income Tax Credit (EITC) for childless workers, which would be expanded significantly for just one year (2022) under Build Back Better.
Smaller Tax Reductions, or Even Tax Increases, Take Effect By 2025
By 2025, the distribution of tax changes looks quite different from 2022:

Taxpayers making less than $50,000 per year would still see a decrease in their tax liabilities in 2025 relative to current law, but the proportional size of the tax change is much smaller than in 2022. By 2025, under JCT’s assumptions, the expanded CTC and EITC are years in the past. Taxpayers making between $50,000 and $200,000 would see their tax liabilities collectively increase, but only by a little less than $6 billion on net in calendar year 2025.
Interestingly, taxpayers making between $200,000 and $1 million would still see a net decrease in their tax liabilities in 2025. As noted above, this is likely due to the effects of raising the SALT cap, which under current law would be $10,000 in 2025 but under Build Back Better would be $80,000 in that year. Taxpayers earning more than $1 million per year would see their taxes go up the most, on a nominal and relative basis, in 2025.
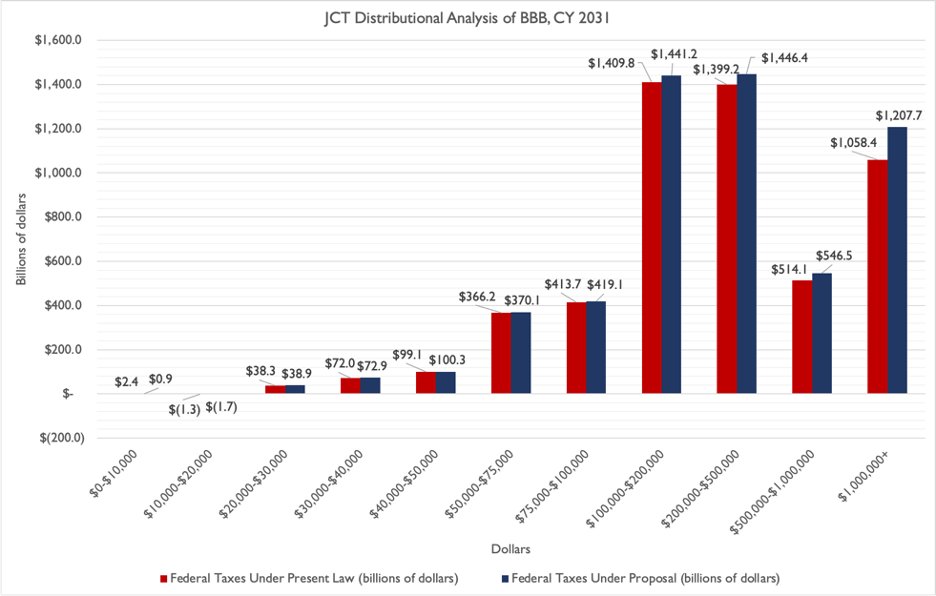
By 2031, the final year of the 10-year outlook, every income group making more than $20,000 per year would have a higher federal tax liability under Build Back Better than under current law. Taxpayers making between $20,000 and $100,000 per year would see their tax liabilities rise by between one percent and 1.5 percent when compared to current law projections, while taxpayers making more than $100,000 per year see their tax liabilities rise by higher than two percent. The largest proportion and nominal increase is among taxpayers making $1 million or more per year -- a nearly $150 billion tax increase in calendar year 2031 alone, 14.1 percent higher than current law expectations.
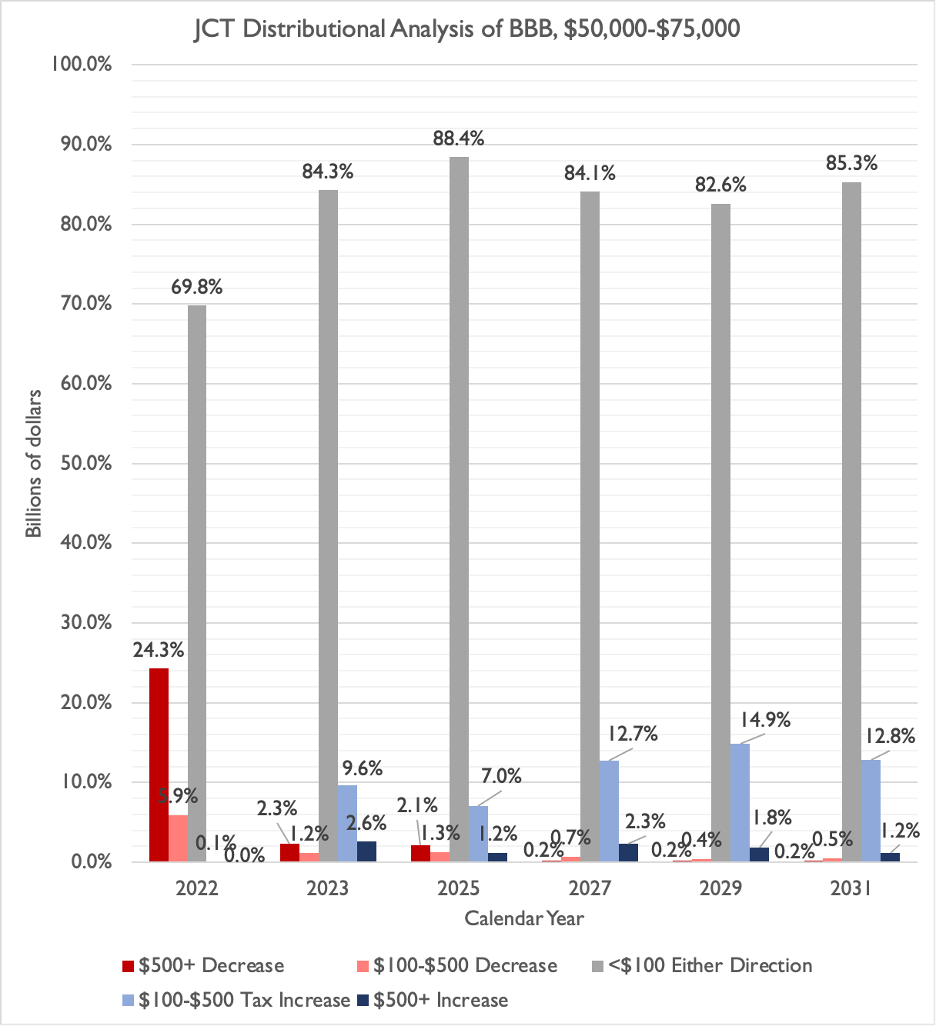
Most Taxpayers Making Between $40,000 and $75,000 Per Year See Few to No Tax Changes
Despite some of the headline tax changes of Build Back Better, such as an expanded CTC and making wealthy taxpayers “pay their fair share,” the net impacts of the temporary tax cuts and the permanent tax increases in the legislation are relatively small. The overwhelming majority of taxpayers making between $40,000 and $75,000 -- comprising a little less than 30 percent of all taxpayers in 2018 -- see tax changes of less than $100 after 2022.
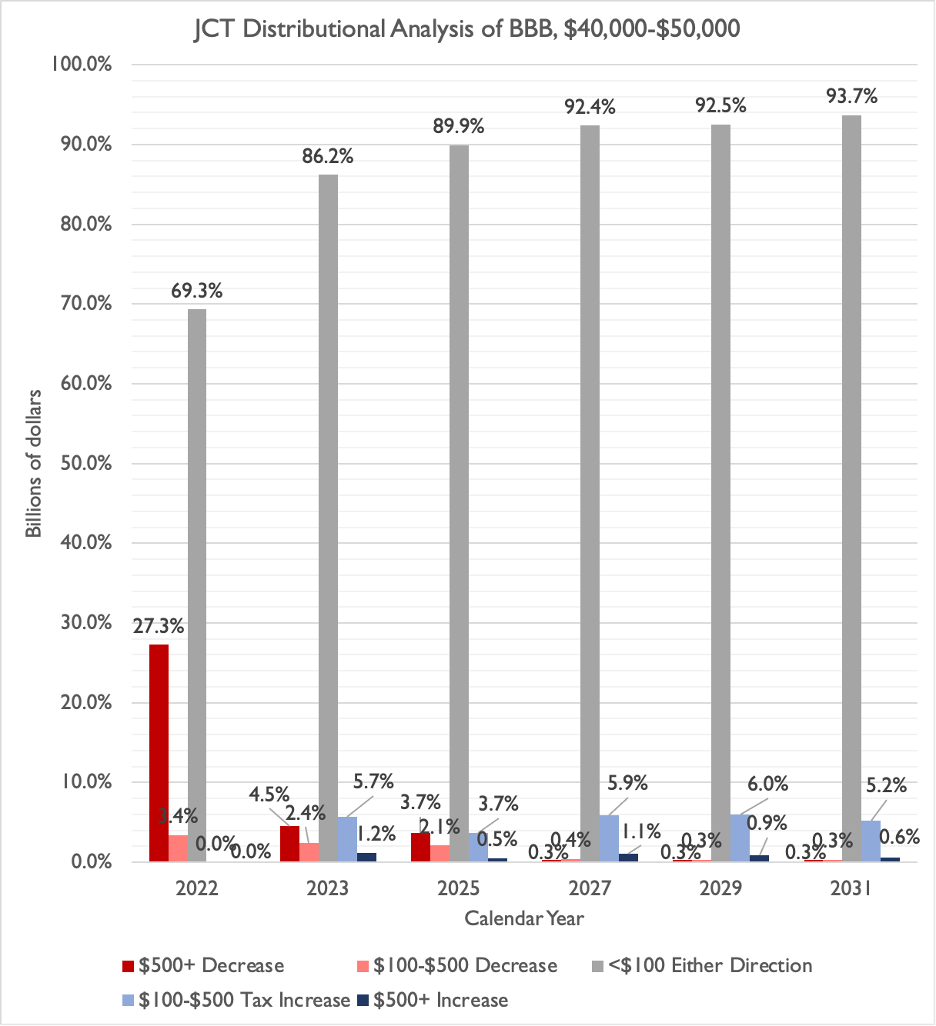
While an extended CTC could significantly change the makeup of these tables in future years, Congressional Democrats have still not proposed ways to pay for an expanded CTC. The Penn Wharton Budget Model (PWBM) has estimated a permanently expanded CTC would cost more than $1.8 trillion over the next decade alone.
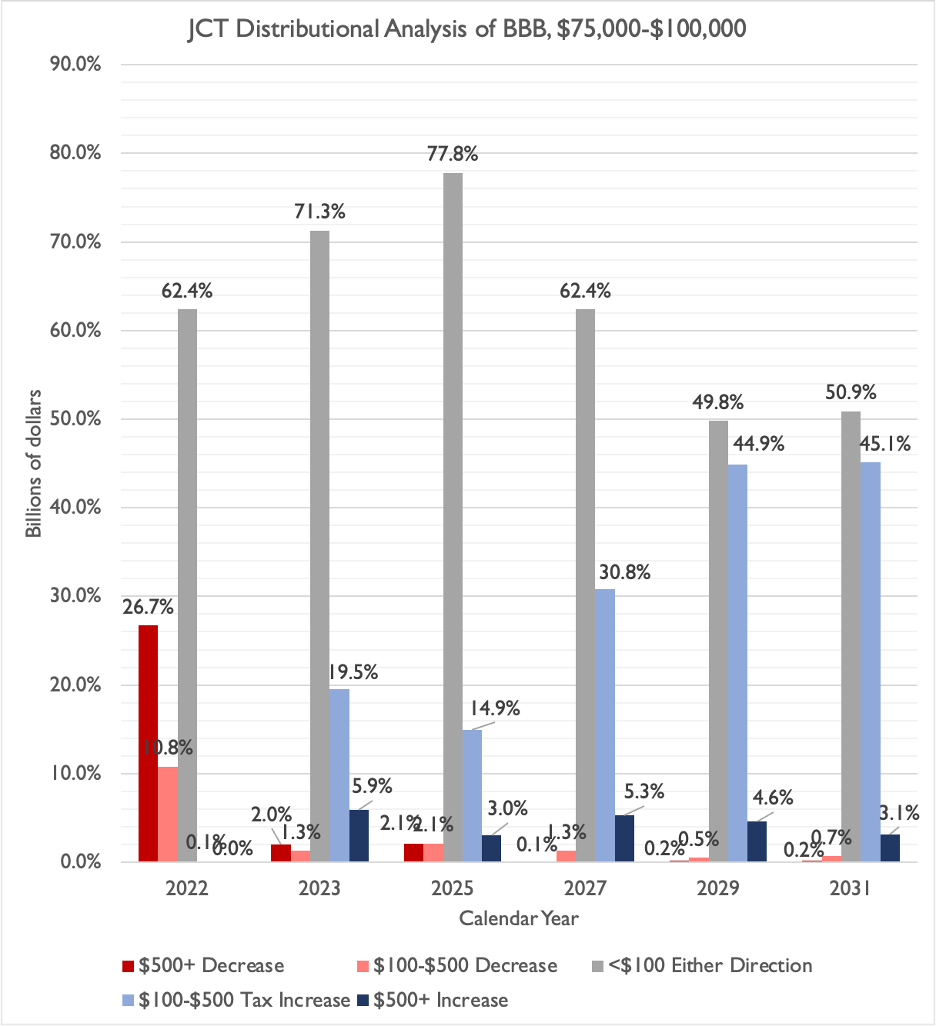
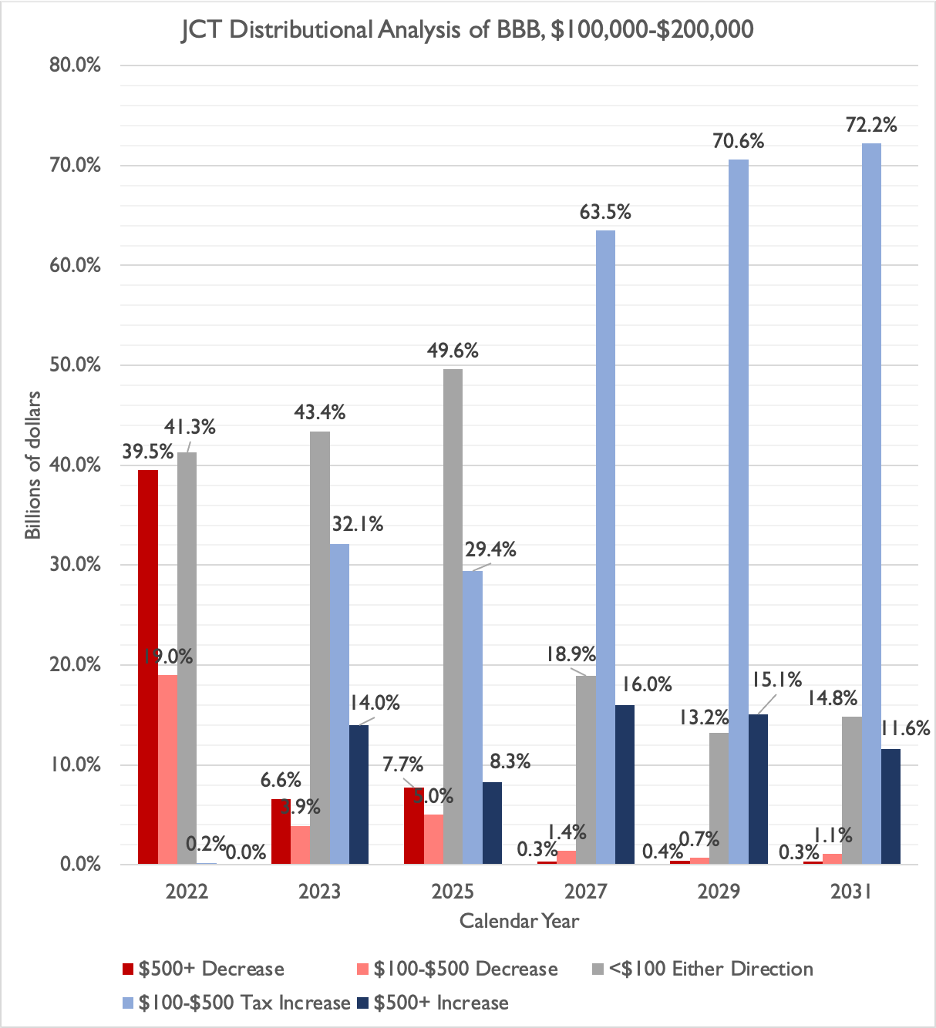
Many Taxpayers Making Between $75,000 and $200,000 Pay More in Taxes By 2023
As opposed to the roughly 30 percent of taxpayers making between $40,000 and $75,000, many of the nearly 34 percent of taxpayers making between $75,000 and $200,000 would pay more in taxes starting in 2023, and especially from 2027 on. An overwhelming majority of taxpayers making between $100,000 and $200,000 would pay at least $100 more in taxes in 2027, 2029, and 2031, while nearly half of taxpayers making between $75,000 and $100,000 would pay at least $100 more in taxes in 2029 and 2031.
While these taxpayers are not near the poverty level and may not be struggling financially as much as their peers in the bottom 50 percent of income earners, they still -- as noted above -- make up more than a third of all taxpayers. Many are in the middle class. Indeed, many of them likely fall under President Biden’s pledge not to raise taxes on households making more than $400,000. The JCT analysis would suggest that the tax changes in the Ways and Means title of Build Back Better violate the spirit, if not the letter, of President Biden’s pledge.