
(pdf)
Executive Summary
Prescription drug costs are often in the public policy spotlight. One of the most recent examples is the Inflation Reduction Act (IRA) of 2022, which requires Medicare to set the price for some brand-name drugs in the program and requires drug manufacturers to rebate Medicare if they increase their prices faster than inflation.
Unfortunately, proponents of prescription drug price controls like those in the IRA often fail to conduct a truly thorough and comprehensive analysis of the costs and the benefits prescription drugs offer patients, doctors, and taxpayers. This paper is focused on doing so.
Academic literature indicates that advances in medicine have brought trillions of dollars of benefits to the American economy in recent decades, helping people live and work longer, lead healthier and more productive lives, and avoid more expensive medical interventions that occur in hospital or physician settings. This is perhaps one reason why prescription drug spending remains a relatively small portion of overall health spending (less than 10 percent of national health expenditures) and of the nation’s economic output (less than two percent of GDP).
Future innovations can also save taxpayers money on federal health programs, arguably the greatest source of upward pressure in the federal government’s budget for the years and decades to come. A 2019 study in Health Affairs, for example, found that increased medication use for hypertension, high cholesterol, and diabetes alone led to an $824 per person slowdown in Medicare spending growth in the 2000s.
We examine several case studies that explore cost-benefit analyses for particular conditions. For example, a new generation of anti-obesity medications, increasingly accepted by private insurers and public programs, could significantly reduce the health-related costs of this condition, which have been variously defined and estimated to cost the U.S. economy between $200 billion and more than $500 billion per year. We also examine how generic medications have offered numerous benefits to consumers (who enjoy lower prices from increased competition) and taxpayers (who pay less for Medicare and Medicaid when those programs increase their share of prescriptions filled by lower-cost generics).
Using these case studies as a backdrop, we offer several pro-consumer and pro-taxpayer policy alternatives to the more counterproductive paths of price controls, such as: streamlined Food and Drug Administration approval processes and expedited inclusion of cost-saving drugs in Medicare and other government reimbursement chains, guarding against punitive tax policies toward research and development, and removing policy incentives that distort list prices (to name just a few).
It is up to policymakers in Congress and the executive branch to ensure that future innovations bring trillions of dollars more in economic, financial, and social benefits to American consumers.
Introduction
It seems difficult to remember a time when health care costs, especially new treatments involving prescription drugs, were not a part of the national policy discussion. One of National Taxpayers Union’s first comprehensive policy blueprints for Congress was published some 45 years ago, when the organization made recommendations for market-based options to then-Sens. Ted Kennedy’s (D-MA) and Ron Dellums’s (R-CA) proposals for national health insurance, which had already been evolving several years prior to that time. Our Task Force Report, entitled ”A New Direction for American Health Care,” noted that:
“FDA [the Food and Drug Administration] policy places the burden of proving safety and efficacy on the drug manufacturer, which usually requires expensive, time-consuming research. Though the purpose of these requirements is to keep harmful or useless drugs off the market, the result is the inhibition of research on all new drugs. The entire rate of production of new drugs has been reduced 60% since 1962, the year that Congress granted vast new powers to the FDA. Some FDA officials concede that vital drugs like penicillin, aspirin, digitalis, and insulin would not be approved were they introduced today.
The bureaucracy and paperwork that FDA policies engender are astounding. Today it takes an average of [7.5] to 15 years after discovery for a new drug to reach the market. Development costs for each drug generally run from $15 [million] to $20 million; up to 200,000 pages of documentation are necessary. As a result of this bureaucracy, lifesaving drugs take much too long to reach the consumer.”
While numerous laws have been enacted since the 1970s to address the affordability of health care, the words above continue to have relevance today. Most incredibly, the costs quoted above are quaint in comparison to today, where drug development costs are 50 to 100 times higher.
Many public officials, focused on upfront government expenses for treatments, patients’ out-of-pocket costs, insurance regulations, and “bending the curve” over a 10-year federal budget scoring window, tend to overlook the fiscal benefits that accrue to taxpayer-funded health care systems from investments made for innovative treatments. These include not only blockbuster drugs, but also generic and biosimilar medications, medical devices, telemedicine, and other therapies that reduce hospital stays or expensive surgeries.
Our paper will explore in-depth the pharmaceutical aspects of this list. Because prescription drugs are often the most direct experience that patients have with paying for their health care, they are often foremost in the public square. NTU will demonstrate there is significant historical evidence – and equally significant future promise – that pharmaceutical development is a great boon for taxpayers, not just for patients. Thoughtful public policy can ensure that this future promise is realized for the benefit of all.
COVID-19: A Timely Lesson in Health Care Economics
The health, economic, and fiscal toll of the COVID-19 pandemic in the U.S. has been unimaginable since the first recorded American case on January 20, 2020. As of March 2023 – three years since COVID-19 officially reached our shores – there have been over 100 million cases in the U.S. and, tragically, over one million deaths.
Government-imposed economic shutdowns contributed to an extraordinary 10.2 percent contraction in the U.S. economy from its pre-COVID peak, before economic output rebounded through the rest of 2020 and 2021. The unemployment rate reached a pandemic high of 14.7 percent in April 2020 – the highest rate recorded in U.S. labor data going back to 1948.
Two different sessions of Congress passed a total of six pandemic relief laws that spent $4.6 trillion and reduced taxes another $560 billion, in aggregate a $5 trillion infusion of fiscal response, passed over just one year, that exceeded any other year’s total federal government spending before fiscal year 2020.[1]
Just as the health, economic, and fiscal toll of the virus has been unimaginable, the nation’s scientific advances to provide the world with some level of immunity from the disease have been extraordinary. While the private sector typically assumes the lion’s share of funding obligations for pharmaceutical research and development,[2] the federal government made expanded investments in the research, development, procurement, distribution, and administration of COVID-19 vaccines into the arms of tens of millions in the U.S. and around the world.
Congressional Budget Office (CBO) research indicates federal assistance for COVID vaccine research and development (R&D) exceeded $19 billion as of March 2021, while a broader measure of federal spending on vaccine R&D, manufacturing, procurement, distribution, and administration indicates federal investments of around $37.3 billion as of February 28, 2022.[3]
Was it worth it to the American taxpayer who funded those investments? Let’s start with a crude analysis.
The $37.3 billion spent on vaccine R&D, manufacturing, administration, and more adds up to about $166 per taxpayer.[4] Two of the most popular vaccines cost between $15.00 per dose and $19.50 per dose, respectively, while Medicare is paying $40 for administering each dose of the vaccine. An individual with two doses plus two boosters could tally up the math – four doses of vaccine plus four administration fees – and come to $220 or $238, already significantly more value than the average $166 per taxpayer investment in vaccines.
This is just the tip of the iceberg, though. Consider that, according to the Department of Health and Human Services, the COVID-19 vaccines saved Medicare $2.6 billion in reduced hospitalizations over five months of 2021 alone. A year of savings at that rate ($6.2 billion in total) would save the average taxpayer $27.50, more than the procurement costs for a two-dose regimen of one of the vaccines.
The largest part of that iceberg, though, is the economic and societal normalcy afforded by the COVID-19 vaccines. Vaccine development normally takes 10 to 15 years, and several companies around the world developed COVID vaccines in less than a year – a historic feat. CBO noted in June 2020, before the completed development of U.S.-sponsored COVID vaccines, that the “successful deployment of a vaccine” could:
- “[E]nable economic activity to rebound”;
- Lead to fewer Americans unemployed;
- Increase federal and state government tax revenues from economic activity (e.g., individual income taxes, payroll taxes, and corporate income taxes);
- Reduce government, insurer, and consumer spending on COVID-19 treatment, while increasing health spending on services “deferred because of the pandemic”; and
- Potentially boost Social Security and Medicare spending, as elderly individuals live longer.
One need only look at CBO’s updated “baseline” expectations for government revenues and U.S. economic activity to see how widespread COVID-19 vaccination helped contribute to an economic (and revenue) rebound in the country, as CBO predicted:
- In its September 2020 baseline, CBO projected individual income tax revenue would be $6.8 trillion from fiscal years (FYs) 2020-2023; in its May 2022 baseline, that estimate (including actual revenue totals from FYs 2020 and 2021) is now $8.8 trillion – a more than $2 trillion difference in revenue over four years;
- CBO projected a total of $75.5 trillion in real economic activity from calendar years 2020-23 in its September 2020 baseline (adjusted for inflation, in 2012 dollars); in its May 2022 baseline, that estimate (including actual economic activity in 2020 and 2021) is $78.7 trillion, a $3.2 trillion difference over four years.
Not all of this rebound can be attributed to the vaccine. But there is no doubt that widespread distribution of COVID-19 vaccines aided in the nation’s economic rebound from the depths of the pandemic, providing significant economic and fiscal benefits to the nation and its taxpayers well beyond the dollar-value benefit of a vaccine dose or even related savings on more expensive medical interventions (e.g., hospitalizations).
The non-partisan think tank Heartland Forward attempted to put a dollar figure on the economic savings offered by the vaccine: $438 billion in 2021, with a low-range estimate of $287.6 billion and a high-range estimate of $588.4 billion. Heartland also cites a Goldman Sachs estimate that, had vaccines never been developed, the U.S. economy would have experienced a permanent loss of around four percent of GDP. And the Penn Wharton Budget Model (PWBM) found in March 2021 that “doubling the number of vaccine doses administered daily [from 1.5 million per day] to 3 million per day would [have] boost[ed] employment by more than 2 million and real GDP by about 1 percent over the summer, with smaller effects later in the year” – GDP effects totaling in the hundreds of billions of dollars.
It is also important to consider how improving other health outcomes could have mitigated the impacts of COVID-19, while also making the post-vaccine recovery quicker and more robust. As a later section explains, for example, obesity is associated with many comorbidities, and according to the Centers for Disease Control (CDC), obesity is one of several factors increasing the susceptibility to and the severity of COVID. This has meant vastly increased risk of hospitalization (over 300 percent), invasive treatments such as ventilators, and death.[5]
In short, the COVID-19 vaccines’ benefits – to public health and economic activity broadly, and to tax revenues specifically – have likely outstripped federal taxpayer costs by many, many multiples. And although the pandemic may provide the most recent and vivid context for this paper, there are numerous additional examples to follow that link the health and fiscal outcomes of prescription drugs.
The Case for Cost-Benefit Analysis: More Important than Ever Before
Qualitative and quantitative cost-benefit analysis can and should be considered by policymakers for all sorts of medical interventions, from prescription drugs to medical devices. The Biden administration has touted COVID vaccines’ savings to the Medicare program in terms of reduced hospitalizations, so it was puzzling to see the same administration and its allies in Congress push aggressively for federal government price controls on prescription drugs and celebrate a version of those controls signed into law under the Inflation Reduction Act.
NTU and its colleagues have long warned that successful federal efforts to fix or control the price of prescription drugs at below-market rates would “[lead] to shortages, [squeeze] the cost bubble toward some other portion of the economy, and [impose] a deadweight cost on society.”
Despite our persistent warnings, too many policymakers continue to cherry-pick unflattering list price data for complex prescription drugs – often treating complicated diseases and conditions – to justify having federal legislators and regulators march in and determine what medicine is worth to the patient, their doctor, and the company that may have sunk more than a decade into that medicine’s R&D and approval.
These policymakers – some of whom mean well in attempting to support the one in roughly six Americans who report having at least some difficulty affording drugs – seek sweeping, nationwide changes to the only country in the world that develops 90 percent of new drugs but fills 90 percent of its prescriptions with generic competitors, where nearly half of those taking prescription drugs say it’s “very easy” to afford their medicine and another 30 percent say it’s “somewhat easy.”
In this context, it is clear that many public officials have yet to grapple with just the kind of cost-benefit analysis that we have just reviewed above, as it pertains to the COVID-19 vaccine.
What follows is a brief review of literature and several case studies that attempt to examine how much medicine is worth to the American taxpayer.
Prescription Drug Spending and Research in Context
A first, and necessary, step to understanding how prescription drug developments have benefited American taxpayers is to put prescription drug spending and research in context – both for the entire U.S. economy and for the health sector specifically. For this reason, our paper provides an extensive Appendix on drug price trends, R&D expenditures, as well as drug marketing and approval challenges, as a supplement. Readers are encouraged to fully consult this Appendix, in addition to the very brief summary that follows.
Although prescription drug prices are often discussed in debates about the American health care system, prescription drug spending made up only 1.62 percent of the nation’s gross domestic product (GDP) in 2021. This is more than triple prescription drug spending’s share of economic output in 1970 (0.51 percent), but pales in comparison to total national health expenditures (18.25 percent in 2021), hospital spending (5.68 percent of GDP in 2021), and even physician spending (3.71 percent of GDP in 2021).
We must also put prescription drug R&D spending into perspective. Developing innovative treatments and cures, and successfully earning regulatory approval for prescription drugs, is extremely difficult and extremely costly.
According to CBO, in 2019 “[t]he pharmaceutical industry devoted $83 billion to R&D expenditures … about 10 times what the industry spent per year in the 1980s, after adjusting for the effects of inflation.”
This is more than double the federal government’s contributions to basic life sciences research through the National Institutes of Health (NIH), which was $41 billion in 2020, though as the non-partisan Congressional Research Service (CRS) has pointed out the federal government contributes to industry R&D in more indirect ways (including through the patent system and with federal subsidies to health coverage that can increase use of and demand for prescription drugs).
Furthermore, the pathway from pre-clinical testing to approval for new drugs typically takes about 12 years. Prescription drugs are priced in part due to this long approval timeline and to compensate for a manufacturer’s drug failures, which far outpace its success stories. (Please consult the extensive Appendix to this paper for additional, important details.)
Despite a relatively modest consumer and provider spending footprint, along with serious research investments and development hurdles, the “success stories” that do result often deliver measurable, even monumental, contributions to the well-being of the economy and taxpayers. The following section provides an overview of how and why these contributions work.
Prescription Drug Benefits to the U.S. Economy
A 2006 Journal of Political Economy (JPE) study by Kevin M. Murphy and Robert H. Topel of the University of Chicago and National Bureau of Economic Research (NBER), titled “The Value of Health and Longevity,” aims to put a price on the value of life expectancy and health gains in the U.S. since the 1970s.
The authors report (emphasis ours):
“From 1970 to 2000, gains in life expectancy added about $3.2 trillion per year to national wealth, with half of these gains due to progress against heart disease alone.”
The gross economic gains over 30 years, from 1970 to 2000, were $95.3 trillion in total (or around $137.2 trillion in 2022 dollars, using the Office of Management and Budget’s chained GDP price index). The plurality of gains occurred in the 1970s ($47.2 trillion), with smaller but still significant gains in the 1980s ($24.5 trillion) and the 1990s ($23.6 trillion).
After accounting for increased expenditures from health and life expectancy gains – such as the costs of these medical innovations and interventions, and increased costs for social insurance and old-age care as Americans live longer – the net economic gains to the U.S. still total $60.6 trillion (or $87.3 trillion in 2022 dollars).
Of course, the JPE study covers all sorts of medical and health interventions that increase life expectancy, improve quality of life, and improve health outcomes – not just prescription drugs.
Prescription Drug Benefits to the Health System
Additional foundational studies from NBER and CBO have attempted to isolate the effects prescription drugs have had on life expectancy, health spending, and the U.S. economy.
A 2002 NBER working paper from Columbia University’s Frank Lichtenberg found that “a reduction in the age of drugs utilized reduces non-drug expenditure 7.2 times as much as it increases drug expenditure.” In layperson’s terms, new prescription drug development saves those paying for health care (including patients, insurers, and taxpayers) much more money than the cost of a newer and more expensive prescription drug.
Lichtenberg offers an example:
“For example, reducing the mean age of drugs used to treat a condition from 15 years to 5.5 years is estimated to increase prescription drug spending by $18 but reduce other medical spending by $129, yielding a $111 net reduction in total health spending.”
A majority of the net reduction is from reduced hospital visits ($80, or about 72 percent of the net reduction in health spending). Another 22 percent ($24) comes from reduced physician office expenditures.
The savings are more pronounced in Medicare:
“In the Medicare population, a reduction in the age of drugs utilized reduces nondrug expenditure by all payers … 8.3 times as much as it increases drug expenditure; it reduces Medicare non-drug expenditure 6.0 times as much as it increases drug expenditure.”
A 2007 NBER working paper from RAND Corporation’s Baoping Shang and Dana P. Goldman reaches a similar conclusion for prescription drug spending in Medicare, though they project smaller savings than Lichtenberg did in 2002:
“Each $1 increase in drug spending is associated with a steady-state $2.06 decrease in Medicare Part A spending and $0.44 decrease in Medicare Part B spending.”
A 2012 CBO report is less bullish on health savings from prescription drug spending than the 2002 or 2007 NBER papers, but still finds savings to the health system that offset the increased costs of prescription drug coverage:
“...the Congressional Budget Office (CBO) estimates that a 1 percent increase in the number of prescriptions filled by beneficiaries would cause Medicare’s spending on medical services to fall by roughly one-fifth of 1 percent.”
Unlike Lichtenberg’s 2002 working paper and Shang’s and Goldman’s 2007 working paper, though, CBO only looks at reductions in Medicare spending – where the population is generally older and has more health spending than the American population writ large – and CBO looks at how an increase in prescriptions filled (not drug spending) affects non-drug Medicare spending.
The potential savings examined by CBO are still substantial. They estimated in 2012 that closing the Medicare Part D donut hole and reducing out-of-pocket costs in Part D would cost $86 billion gross, but only 59 percent of that total on net ($51 billion) after accounting for reduced spending on medical services under Medicare (-$35 billion).
A more recent 2019 study in Health Affairs, covering per capita Medicare spending from 1999 through 2012, found that Medicare spending growth began to slow down starting in 2005 and that by 2012 “actual spending [per capita] was $2,899 (14 percent) less than the forecasted trend.” The authors attributed more than half of the “reduction in cardiovascular disease events” (a major driver of the spending growth slowdown in Medicare) to “increased medication use for hypertension, high cholesterol, and diabetes” – an $824 per capita slowdown in spending growth total.
Having established the context of prescription drug spending and research, and in comparison to prescription drugs’ benefits to U.S. economic output and to the broader health care system, it’s worth exploring some case studies for the next frontier in prescription drug R&D. Policymakers can learn from the recent successes and failures of the private sector, but first and foremost should aim to do no harm to the ecosystem carefully developed by the public and private sectors over recent and successful decades.
Next Frontier Case Studies: Obesity
An emerging controversy in private insurance and in the federal health programs is over coverage of anti-obesity medications (AOMs). The New York Times published a feature piece on this phenomenon last year with the headline, “The Doctor Prescribed an Obesity Drug. Her Insurer Called It ‘Vanity.’”
According to the Times, an “all too common” response from private insurance companies and “the universal response” from Medicare Part D is to deny coverage of AOMs.
This reluctance may have its roots in the late 1990s, just prior to the creation of Part D. At that time, FDA-approved weight loss drugs such as fenfluramine, dexfenfluramine, and phentermine were being prescribed by providers for weight loss. Yet, when taken together, fenfluramine and phentermine, popularly known as “Fen-Phen,” became linked to heart valve problems in some patients. In 1997, this led FDA to act on the side of abundant caution and ask the manufacturers of fenfluramine and dexfenfluramine to pull their drugs off the market. Other weight-loss medications with possible cardiovascular links also left the shelves.
By the time Part D was launched in the early 2000s, the media uproar over these drugs’ side effects was likely still in the minds of program administrators. Yet, the FDA has since shaken off that reluctance, beginning with development guidance to the industry in 2007 that has led to a new generation of some half a dozen approved AOMs.
A more robust cost-benefit analysis should lead policymakers in Congress, the Centers for Medicare and Medicaid Services (CMS), and in the private health insurance sector to think differently about covering AOMs now. Some states, however, are already covering AOMs in Medicaid (at least 15, according to a February 2022 report from the Urban Institute) and in State Employee Health Plans (at least 16, according to a 2021 STOP Obesity Alliance report).
New Mexico has gone so far as to provide wide coverage of AOMs in its statewide “Essential Health Benefit Benchmark Plan,” a concept established under the Affordable Care Act (ACA) to define coverage standards for individual and small group markets. The reason was that health actuaries identified specific beneficial health and fiscal outcomes compared to a cost of increased claims that was statistically insignificant, at 0.03 percent.[6]
According to the CDC, an average of 42 percent of Americans had obesity from 2017 through March 2020. The CDC writes that obesity-related conditions “include heart disease, stroke, type 2 diabetes and certain types of cancer … among the leading causes of preventable, premature death.”
The financial burden on the American health system from obesity and obesity-related conditions, according to the health agency, is around $173 billion annually (in 2019 dollars) – more than the federal government spent on nutrition programs ($162 billion), or higher education ($143 billion), or veterans ($125 billion) in fiscal year 2021, for example.
Other academic papers have estimated different annual burdens to the American economy and public due to obesity and obesity-related conditions; at least one paper estimates slightly smaller burdens but several estimate larger burdens.
A 2021 Journal of Occupational and Environmental Medicine (JOEM) paper estimated that the “annual medical cost of obesity in the United States was $147 billion” (in 2008 dollars). A 2017 Johns Hopkins University (JHU) study found that “[m]ore than 70 percent of adults in the United States are considered to be overweight or obese, which in direct medical expenses alone costs nearly $210 billion per year.”[7]
A 2015 PharmacoEconomics paper found that “adult obesity raised annual medical care costs by $US3,508 per obese individual, for a nationwide total of $US315.8 billion” (in 2010 dollars). And a 2019 Journal of Medical Economics (JME) paper found that the “estimated economic burden of obesity and obesity-related treatment was $427.8 billion in 2014, an amount that has undoubtedly escalated in subsequent years alongside the rising number of people with obesity.” All of these figures, adjusted to 2022 dollars, would of course be higher, in the latter case exceeding $500 billion.
These papers all vary in how they define financial and economic burdens of obesity and obesity-related conditions, and they vary in whether they also include the direct and indirect costs for treating overweight individuals and their associated conditions, but each paper has a common conclusion: obesity and the conditions associated with obesity cost the U.S. health system tens of billions of dollars per year at minimum.
Each of the papers or studies cited above also discuss whether weight loss generally – or AOMs specifically – could present savings to the U.S. health system by reducing costly obesity-related conditions:
- The JOEM paper found that “[e]xpected savings associated with weight loss varied by condition” (with greatest savings from diabetes and hypertension), by the baseline body mass index (BMI) for the person losing the weight (the higher the baseline BMI, the greater the savings), and by level of weight loss (the greater the weight loss, the greater the savings);
- The JHU study found “a 20-year-old adult who goes from being obese to overweight would save an average of $17,655 in direct medical costs and productivity losses over his or her lifetime,” while a 40-year-old would save an average of $18,262; the study also found “cost savings peak at age 50 with an average total savings of $36,278 … emphasizing the importance of weight loss as people age”;
- The PharmacoEconomics paper found that “[t]he heavier the obese individual, the greater the reduction in medical care costs associated with a given percent reduction in BMI,” but also that “doubling the weight loss [for an individual does not double the savings”; the paper also found, importantly, that “substantial medical expenditure savings can be achieved by interventions that can reduce BMI by 5–10 [percent]”;
- Finally, the JME study specifically looked at whether Medicare could actually save taxpayer dollars by increasing its coverage of AOMs; they found that “expanding coverage of anti-obesity interventions to eligible individuals could generate $20–$23 billion budgetary savings to Medicare over 10 years,” or $6,842 over 10 years for “treated participant” (offset by $1,798 in intervention costs) and $308 over 10 years for each beneficiary (treated or untreated).
On its face, one recent analysis provides a counterpoint to the above four studies, suggesting that widespread adoption of AOMs among Medicare beneficiaries could significantly increase program costs. The comparatively brief New England Journal of Medicine perspective piece posits that 10 percent uptake of a brand-name AOM in Medicare could increase Part D spending by 20 percent. The analysis, however, has significant limitations:
- The authors did not consider offsetting reductions to other medical spending or non-AOM pharmaceutical spending as a result of AOM uptake;
- The authors utilized Institute for Clinical and Economic Review (ICER) data to measure the cost-effectiveness of generic and brand-name AOMs, even though ICER data measures cost effectiveness compared to “lifestyle modification alone” – a more realistic (or at least alternative) cost-effectiveness baseline would compare a variety of health interventions to a patient taking no interventions; and
- It is unclear that current net prices for generic and brand AOMs would hold if there was widespread coverage and then adoption in Medicare Part D, even though the authors use current net prices to measure the potential budgetary impact of AOM adoption in Medicare.
Policymakers should study the costs and benefits of AOM adoption further, ideally including experts at the Congressional Budget Office (CBO) to measure potential tradeoffs, as well as other sources. The JME study in particular demonstrates that Medicare – and taxpayers by extension – could indeed see cost savings with AOM interventions.
Next Frontier Case Studies: Alzheimer’s
Another case study involves the decades-long search for drugs that can treat patients with symptoms of Alzheimer’s disease – one marked by sporadic approvals of new drugs, reversals in government reimbursement for coverage, and controversies over patient affordability.[8]
A thorough review of the costs Alzheimer’s disease imposes on the American public, and federal regulatory decision-making regarding the approval for and coverage of new treatments indicates that, while most of the media focuses on pricing, the question of offsetting financial benefits is often ignored.
Scientific evaluations, among them FDA’s own, vary on efficacy and safety risks of given drugs but the vital question for purposes of this paper is, would a very high price for an Alzheimer’s treatment, even running tens of thousands of dollars a year per patient, be worth it? The research provides many circumstances where the answer would be a resounding “yes.”
The patient group for Alzheimer’s patients and caregivers, the Alzheimer’s Association, recently wrote that in 2022 “the total national cost of caring for people living with Alzheimer's and other dementias is projected to reach $321 billion,” or $41,757 per person living with Alzheimer’s or other dementias. That doesn’t account for an additional $35,330 per person, or $271.6 billion, in the Association’s estimate for unpaid caregiving costs – $77,087 in total direct and indirect costs per patient.
The Alzheimer’s Association estimates that care costs for people with Alzheimer’s will more than triple over the next 30 years:
“Total annual payments for health care, long-term care and hospice care for people with Alzheimer’s or other dementias are projected to increase from $321 billion in 2022 to just under $1 trillion in 2050.”
Conversely, a treatment that delays the onset of Alzheimer’s by five years, if introduced in 2025, could “reduce total health and long-term care spending for people with Alzheimer’s” by a third, according to one study, and by 39 percent according to another study. That would represent tens of billions of dollars in savings per year in the 2020s, and potentially hundreds of billions of dollars in savings per year decades from now.
An earlier study from the Alzheimer’s Association found that a treatment delaying the onset of the disease by five years would save Medicare and Medicaid alone $47 billion in 2030, $105 billion in 2035, $152 billion in 2040, $189 billion in 2045, and $218 billion in 2050 – before accounting for treatment costs. Savings in the first ten years (2026-35) would total $345 billion to Medicare and $189 billion to Medicaid ($534 billion total) – again before accounting for treatment costs.
Alzheimer’s remains a challenging condition to address, and development of additional drug therapies will be a costly endeavor. But as the analysis above indicates, the stakes for patients and taxpayers for developing cures are quite high.
Next Frontier Case Studies: Biosimilars and Generics
Among the most important and promising next frontier in prescription drugs is the rise of lower-cost generics and biosimilars, which 1) create price competition in the prescription drug market and, 2) as noted above, incentivize manufacturers to research and develop more innovative and impactful products that treat or cure expensive and devastating conditions.
The U.S. is the only country in the world that, as NTU has noted before:
“...can boast of such a successful policy environment that both encourages discoveries to reach patients (nearly 90 percent of newly launched drugs worldwide are available here) and controls costs (over 90 percent of prescriptions written in the U.S. are for generics).”
Congress deserves some significant credit in establishing this policy environment, both with the bipartisan Hatch-Waxman drug patent law from the 1980s and the bipartisan biosimilar pathway created by the otherwise-partisan ACA in 2010.
The former law has been around long enough that we know it is a policy success. As NTU wrote in 2019:
“Costly innovator drugs have been shown to reduce other expenses in government health programs over the long term, such as surgeries or long hospital stays. On the other hand, generics deliver massive savings over the nearer term to those same programs as well.
Rather than attempt to legislate massive changes to the FDA’s approval rules, Hatch-Waxman strengthened pharmaceutical patent protections to offset the normally useful patent life that is lost by government-mandated delays in approving an application, completing trials, etc.”
Two modern studies by the FDA, one completed in 2005 and one completed in 2019, confirm that generic competition greatly reduces prices for the drug product subject to competition. The 2005 study found that “[g]eneric competition is associated with lower drug prices, with the entry of the second generic competitor being associated with the largest price reduction.”
The 2019 study, which examined drug pricing data from 2015 through 2017, found that the list price (AMP) for a first generic competitor to a brand-name product is 39 percent lower, on average, than the brand AMP before competition. Throw in two competitors, and prices are 54 percent lower. Four competitors, and prices are 79 percent lower. Six or more competitors, and prices are 95 percent lower than the brand AMP before competition.
The result of generic competition has been lower costs for consumers and taxpayers. The Medicare Payment Advisory Commission has noted in its reporting on the Medicare Part D program this year that “average prices [in Medicare Part D continue] to grow more slowly than in prior years, owing to the decline in prices of generic drugs.”
It is difficult, maybe impossible, to put a dollar figure on the societal and taxpayer benefits of the Hatch-Waxman Act since its passage in 1984. By allowing for generic competition to brand-name products, the law has driven down prices for some popular drugs in a way that government price controls likely never could. By strengthening patent protections for brand-name drugs at the same time, Hatch-Waxman has incentivized manufacturers to take risks, plunge tens of billions of dollars more per year into R&D, and pursue the next frontier in medical innovations – treating obesity, COVID-19, and more.
Solutions: What Should Policymakers Do Going Forward?
As the sections above have shown, the next frontier of American medicine may seek to significantly reduce the negative health outcomes – and health system and economic costs – through innovator drugs as well as competition through biosimilars and generics. This elegant balance must be protected, not undermined.
Congress, executive branch officials, and the American public must be made aware that the benefits flowing to individuals, families, businesses, and taxpayers from investments in medical innovations are much larger than they might appear. In the aggregate, these innovations have generated tens of trillions of dollars in economic benefits to the U.S. alone in recent decades, and could benefit tens of trillions of dollars more in the decades to come – but only if federal policymakers allow innovation, R&D, and regulatory approval pathways to improve and thrive.
Unlike some progressive policymakers advocating for single-payer health care, NTU does not promise a single silver-bullet solution to the challenges facing the slice of Americans who struggle to afford prescription drug costs. In fact, we believe a mix of policy solutions is necessary, with three goals in mind: 1) providing narrowly-targeted relief to the consumers most affected by high out-of-pocket costs, 2) ensuring robust generic and biosimilar competition continues to come to market, driving down prices through market competition, and 3) protecting or even strengthening the policy incentives that incentivize manufacturers to pursue expensive but rewarding risks; i.e., treatments and cures for debilitating medical conditions.
- Reform and Streamline FDA Review and Approval and Update Medicare Reimbursement Procedures for New Drugs
Though we are not experts on prescription drug review and approval, we know from listening to other policymakers and experts that the Food and Drug Administration (FDA) could stand to reform and improve its approval pathways for brand-name drugs, some generic products, and biosimilar competition to complex biological products (like insulin).[9]
The FDA must constantly balance the need for competition in the drug market with the need for safe and effective drugs. Keeping that balance in mind, the agency itself has noted it can improve and streamline its review and approval process for biosimilars and other products. Given the evidence cited above concerning AOMs, for example, timely drug approvals not only for the entire market but also for use in specific government health programs, could save tax dollars as well as lives.
But drug approval is not the only step that is needed – expedited incorporation of drugs into regular treatment and reimbursement procedures for federal programs at the patient level is also necessary. This is especially true for Part D beneficiaries, since the federal civilian health program started providing coverage for AOMs for plan year 2023. Soon, seniors will be the only federal health program participants without access to these drugs, unless officials act.
- Ensure the Tax Code Does Not Punish R&D
In 2022, the tax treatment of R&D expenses changed from immediate expensing – in other words, allowing companies to fully and immediately deduct R&D costs from their income, thereby reducing their tax obligations on that R&D – to five-amortization, requiring companies to spread their R&D costs out over five years on their tax bills. Before this change, companies were able to fully and immediately expense R&D costs for decades. In short, the change to five-year amortization increases companies’ costs for investing in R&D, which may prevent some companies from making more robust R&D investments in years to come and others from making R&D investments at all.
Congress should switch back to immediate R&D expensing this year, applying the change to the 2023 tax year, and there is bipartisan support to do so. The change affects deficits because it reduces taxes, but NTU has offered spending reduction options that would cover the cost of this tax policy change many times over.
- Identify Narrow Solutions That Mitigate High OOP Costs While Respecting Taxpayers
NTU has regularly noted that policy proposals aimed at mitigating high out-of-pocket costs for prescription drugs should actually be targeted at those struggling with high costs, since more sweeping proposals that affect entire markets can have unintended consequences that hurt consumers and taxpayers writ large.
A prime example from the last Congress was Senate insulin legislation. This bill, though likely well-intentioned, was bad policy that would 1) practically reduce prices for a small number of patients using insulin, 2) increase federal deficits by more than $20 billion over 10 years, 3) raise premiums for many individuals in the private marketplace and in Medicare, and 4) actually increase the net price of insulin, according to the Congressional Budget Office (CBO).
In short, the proposal would have increased deficits, premiums, and insulin prices – a triple whammy for taxpayers, consumers, and insulin users.
On the contrary, NTU supported Part D redesign proposals that would have included the first ever out-of-pocket cap for seniors in Part D but still would have reduced deficits by shifting cost burdens away from taxpayers and towards insurers. An obvious potential effect of such proposals is that they increase premiums some amount – as insurers pass on their larger financial obligations to customers – but spread across the tens of millions of Americans in Part D these premium increases would likely be minor, and possibly a welcome trade-off for the protection of an annual out-of-pocket cap in Part D. A version of this Part D redesign was included in the just-enacted Inflation Reduction Act, but unfortunately was accompanied by 1) harmful prescription drug price controls and 2) increased taxpayer funding for Part D premium subsidies, both of which made the policy a net loser for taxpayers.
- Remove Distortions That Incentivize High List Prices
NTU has noted before that the extreme rebates in the Medicaid program – which made up more than half of spending on outpatient prescription drugs in the joint state-federal program in FY 2017, or nearly $35 billion – could actually incentivize high list prices as manufacturers seek to recoup losses from the Medicaid program:
“…this significant distortion of market dynamics leads to 1) less capital and lower incentives for manufacturers to pursue the risky and often multibillion-dollar process of developing drugs, 2) the potential for higher launch prices for new drugs that do make it to market, as manufacturers try to recoup the cost of Medicaid rebates that reduce the value of their drugs by more than half, and 3) less private sector negotiation over drug prices between plans and manufacturers.”
The non-partisan CBO has also noted Medicaid rebates affect launch prices:
“Federal policies have also played a role in the pricing patterns for brand-name drugs. For example, Medicaid’s statutory rebates create an incentive for manufacturers to negotiate higher prices for commercial insurers as well as higher marketwide launch prices. (However, those rebates also create an incentive for manufacturers to increase prices more slowly over time, which probably mitigates the effect of higher initial prices.) In addition, the increase in the share of overall drug spending that is covered by Medicare and Medicaid may dampen the pressure on manufacturers to restrain prices because patients are more willing to purchase high-priced drugs when they have less exposure to those prices.”
CBO has projected that the new Medicare inflationary rebates in the Inflation Reduction Act will lead to higher launch prices for some drugs, primarily affecting Medicaid and Medicare Part B spending. Higher launch and list prices also have a particularly negative impact on uninsured Americans – precisely one of the populations that struggles the most with affording out-of-pocket costs for prescription drugs, since the uninsured often pay for drugs based on list prices. Reducing distortionary rebates in Medicaid (and Medicare Part D) could reduce launch and list prices, lowering the cost of medicine for the uninsured.
- Consider Reforms to Incentivize Competition Along the Pharmaceutical Supply Chain
As noted in our section on “Prescription Drug Spending in Context,” the pharmaceutical supply chain – which includes not only manufacturers but also pharmacy benefit managers (PBMs), wholesalers, pharmacies, and insurers – eats up a significant portion of net revenues for prescription drug products. Non-manufacturer portions of the pharmaceutical supply chain are also much more concentrated than the pharmaceutical manufacturing industry. A 2017 study from the USC Schaeffer Center for Health Policy and Economics illustrates this trend. While the top 21 manufacturers held 70 percent of the U.S. market share for prescription drugs in 2015 (and 90 percent of the share for brand-name drugs), only three PBMs held 66 percent of the U.S. market share. Three wholesalers held 85 percent of the market share in 2015, and five pharmacies held 54 percent market share. The following table from USC-Schaeffer provides more detail:
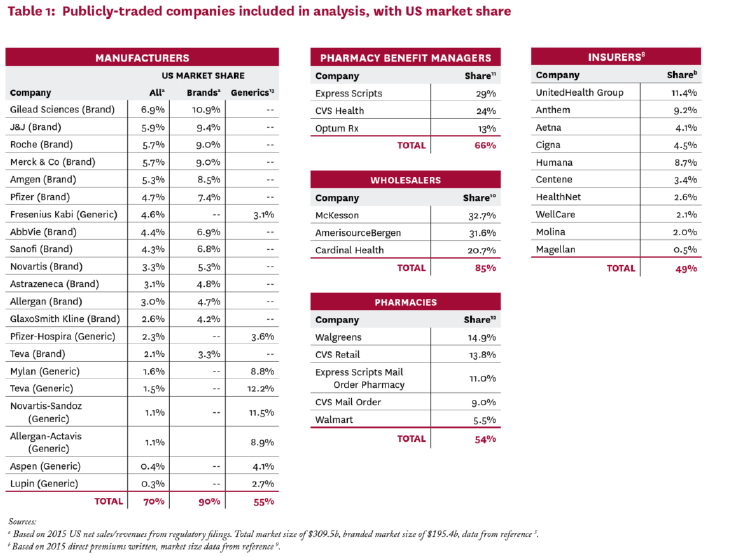
[Graphic via USC-Schaeffer]
Lawmakers should consider whether tax or regulatory policy changes could lead to additional competition in these sectors. Already the private sector is innovating, with industry disruptors like Mark Cuban’s Cost Plus Drugs stepping in as a direct-to-consumer wholesaler for generic products and offering significant savings to consumers.
It’s clear that one option policymakers should not turn to is to sic regulators at the Federal Trade Commission (FTC) or Department of Justice on parts of the pharmaceutical supply chain for aggressive antitrust enforcement. As NTU President Pete Sepp noted all the way back in 2015:
“...antitrust authorities have continuously adhered to inflexible and unworkable doctrines that insist government can tinker with the scales of competition and achieve a better balance than the hand of the free market. Meanwhile, ambitious regulators, some of whom are bent on justifying higher budgets or more prominent headlines, shun legitimate functions of protecting consumers and fostering competition.”
A new majority at the FTC seems intent on radically changing the long-standing and prudent “consumer welfare” standard that has governed antitrust enforcement in recent decades, and should not be empowered to pursue regulatory or legal action against portions of the pharmaceutical supply chain that may not be working as intended.
A better approach would be for lawmakers in Congress to invite industry disruptors like Mr. Cuban in the door, and to ask them 1) how their business model could offer more choices and lower prices to payers, patients, and potentially taxpayers, and 2) what tax or regulatory burdens, if any, stand in their way and could be reasonably reformed in a way that benefits innovators throughout the health care sector.
Conclusion
Placing prescription drug spending in context demonstrates that – though some Americans certainly face unmanageable out-of-pocket costs for their medicines and though prescription drug spending, like other health spending, is on the rise – these products are a far smaller portion of both U.S. economic output and overall national health spending than hospital spending, physician spending, and many other types of health and non-health consumer and taxpayer spending in the U.S.
Squaring prescription drug spending – both public sector and private sector investments – up with the economic and fiscal benefits of prescription drug innovations (and increased utilization) demonstrates that the economic benefits number in the trillions of dollars over the past few decades.
It is up to policymakers in Congress and the executive branch to ensure that future innovations bring trillions of dollars more in economic, financial, and social benefits to American consumers. Importantly, future innovations could also save taxpayers money on federal health programs, arguably the greatest source of upward pressure in the federal government’s budget for the years and decades to come.
The legislative trend has not been encouraging. The prescription drug price controls included in the IRA will siphon roughly $200 billion in revenues away from the pharmaceutical sector and into government coffers for spending on temporary health insurance subsidies and temporary (and unrelated) clean energy projects. The law will require Medicare to set the price of some high-cost, brand-name prescription drugs for the first time – 10 in 2026, elevating to 20 per year from 2029 onwards. Though framed as a “negotiation,” manufacturers who refuse to agree to the government’s desired price will be assessed a 95-percent excise tax on their gross sales. The law also requires all manufacturers providing products to Medicare to rebate the government for any sales prices that are above a broad measure of consumer inflation.
NTU has noted that the new price controls in the IRA will chill incentives for manufacturers to innovate, harm generic competitors, and reduce observable savings to taxpayers from prescription drug innovation and access.
What’s worse, the Biden administration is proposing to effectively double the price controls enacted in the IRA in its new, FY 2024 budget request. These proposals are dead on arrival in the current Congress, but the long-term negative impacts of such proposals, if enacted, could be felt by taxpayers, consumers, and patients for decades.
The NTU solutions outlined in the previous section of this paper would be far more constructive. Such policy measures will help ensure that the next frontier of prescription drugs – to treat Alzheimer’s disease, or obesity, or even to compete with long-standing brand-name products for treatable conditions like diabetes – saves lives and, less important but still vital to a taxpayer group like NTU, saves consumers and taxpayers money.
Policymakers who only consider the list price of a prescription drug, or federal investments in basic research, or the aggregate cost of prescription drugs to a health system that is trillions of dollars larger, are only seeing the tip of the iceberg. It’s time for a more robust conversation over cost-benefit analyses, and hopefully this paper has amplified the voices of taxpayers in the process.
APPENDIX – Prescription Drug Spending and Research in Context
As noted in the body of this paper, although prescription drug prices are often discussed in debates about the American health care system, prescription drug spending made up only 1.62 percent of the nation’s gross domestic product (GDP) in 2021. This is more than triple prescription drug spending’s share of economic output in 1970 (0.51 percent), but pales in comparison to total national health expenditures (18.25 percent in 2021), hospital spending (5.68 percent of GDP in 2021), and even physician spending (3.71 percent of GDP in 2021).
The table below illustrates this phenomenon over time, with the larger, gray bars representing prescription drug spending as a share of GDP.[10]
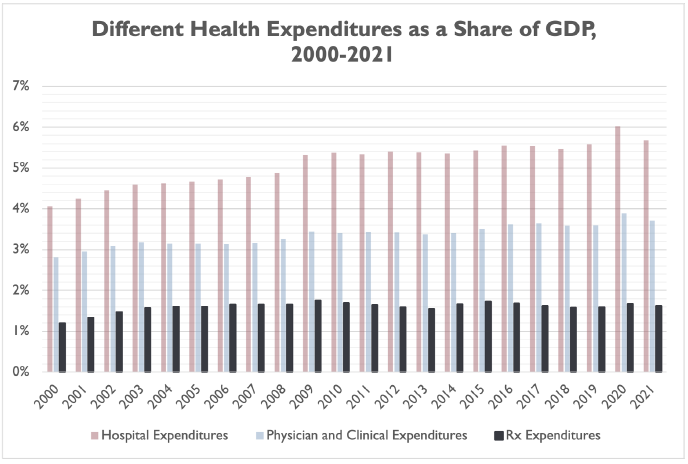
Interestingly, prescription drug spending as a share of GDP has not grown on a linear basis in recent decades. Over the 21-year period illustrated above, prescription drug spending has been as low as 1.19 percent of GDP (2000) and as high as 1.76 percent of GDP (2009).
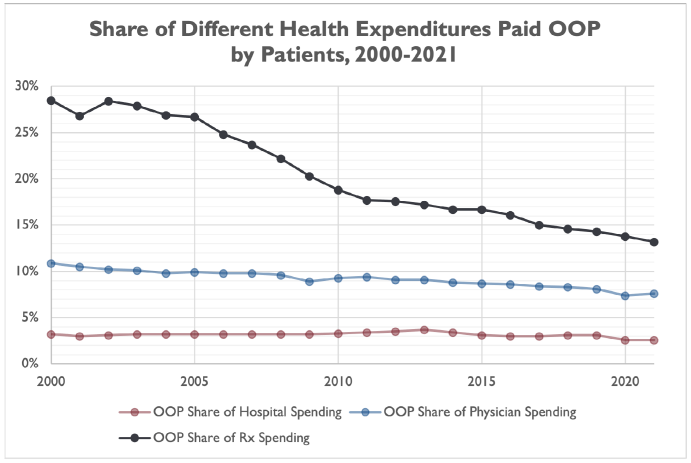
However, Americans have typically paid a higher proportion of their prescription drug costs out of pocket than they do hospital or physician services. This could contribute to an outsized perception that prescription drug spending is driving increases in health spending, even though hospital spending grew at a faster pace than prescription drug spending (as a share of GDP) from 2000 through 2019.[11]
The share of prescription drug spending paid by consumers out of pocket has plummeted from 82.7 percent in 1970 to 13.2 percent in 2021. The share was even cut in half from 2000 (28.5 percent) to 2021 (13.1 percent). However, the share of prescription drug spending paid by consumers out of pocket is still much higher than physician spending (7.6 percent in 2021) or hospital spending (2.6 percent in 2021).
Consumers have expressed outrage when media share stories of exorbitant hospital bills, sometimes the result of “surprise billing” tactics that are supposed to be limited by new laws and regulations, but the truth is that most Americans have the vast majority of their hospital bills covered by insurance or by federal and state health programs – somewhere in the neighborhood of 97 percent, according to CMS data. Comparative consumer exposure to out-of-pocket prescription drug costs may drive a (misguided) perception that prescription drug costs are a larger contributor to health spending increases than hospital or physician costs.
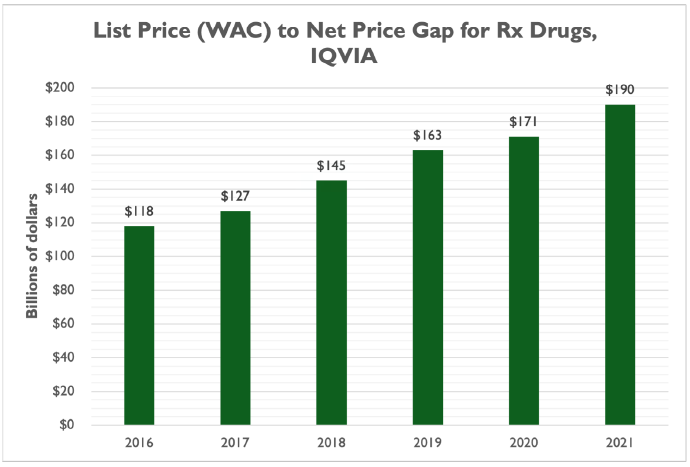
More recent data from IQVIA further demonstrates that prescription drug list prices – which are often cited in news stories or policymakers’ press releases when discussing prescription drug policy – are a poor measure of the price consumers and other private payers actually pay for these products.
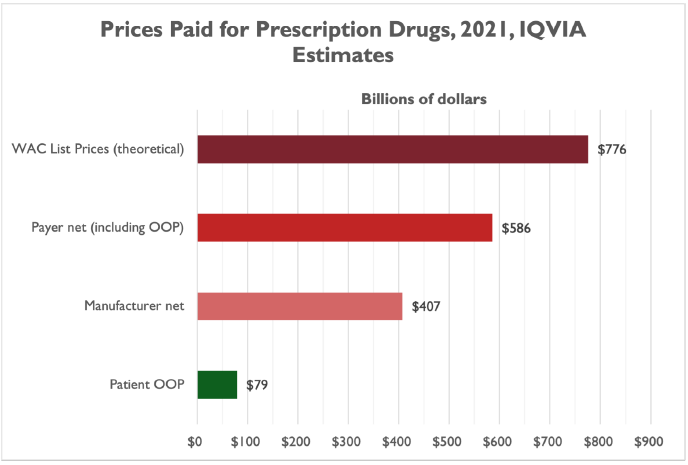
IQVIA’s April 2022 report, “The Use of Medicines in the U.S. 2022,” indicates that the gap between list prices (measured by wholesale acquisition cost, or WAC) and net prices is large and has been growing for years:
“Differences between list price (WAC) spending and payer net spending reached $190Bn in 2021, up from $118Bn in 2016 as negotiated discounts and rebates to payers and providers increase in competitive markets and 340B organizations account for a larger share of medicine use.”
In 2021, prescription drug spending at WAC list prices would have totaled $776 billion – a significant sum, around what the federal government spends on national defense in a year.
As noted above, though, payers don’t pay list prices for prescription drugs. A combination of insurers negotiating lower prices, statutory discounts in the federal health programs, manufacturer discount programs, and other price pressures reduced payer spending by $190 billion, or 24.5 percent of WAC. Net prices paid were only 75.5 percent of list prices in 2021.
About 30 percent of payer net prices go to the pharmaceutical supply chain, including wholesalers, pharmacy benefit managers (PBMs), and pharmacists, leaving manufacturers with $405 billion on net – just 52.5 percent of list prices:
“Manufacturer net revenue is lower than other measures of spending based on a combination of statutory discounts to Medicaid, discounts for 340B eligible institutions, the branded pharmaceutical fee in the ACA, donut-hole subsidies in Medicare Part D, supply chain discounts (often for generic drugs), as well as the value of coupons given to patients.”
And, as also noted above, patient out-of-pocket spending was $79 billion in 2021 – 13.5 percent of payer net costs and only 10 percent of the list price.
IQVIA reports that net manufacturer prescription drug prices have still increased over the years – about $76 billion, or 23.4 percent over five years (an average of 4.7 percent per year) – but more than half of the gross increase ($94 billion of $181.7 billion) is due to increased volume of brand-name drugs rather than new brand drugs coming to market ($87.7 billion of $181.7 billion). The gross increase of $181.7 billion in net manufacturer revenues is offset by $93 billion in revenue losses due to loss of brand exclusivity and the resulting generic competition.
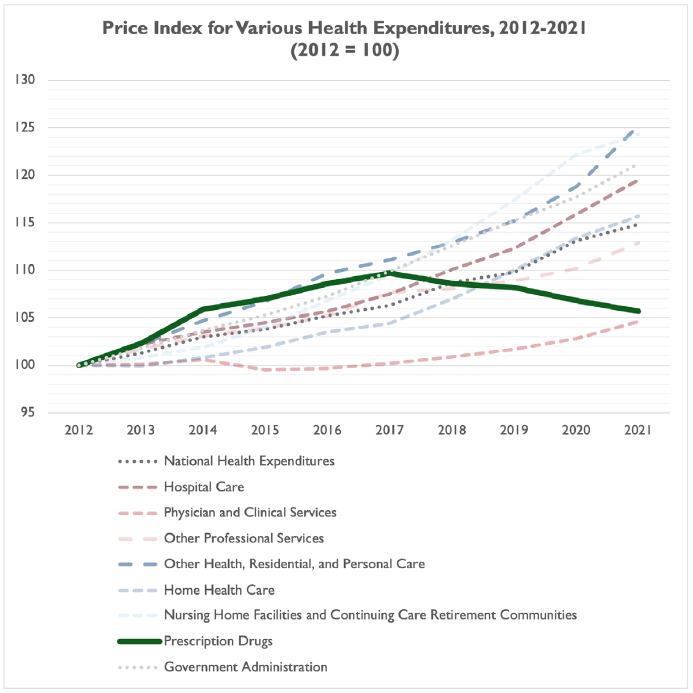
Indeed, prescription drug prices of late have been increasing at a rate less than broad-based consumer inflation, according to IQVIA:
“Increases in prices of protected brands averaged less than 5% for the second consecutive year on a WAC price basis, and 1% on a net price basis, marking the fifth year of net prices at or below the Consumer Price Index.”
Data demonstrates that, while prescription drug costs have risen in the past decade, prescription drug costs are rising more slowly than many other types of health spending, including spending on home health care, nursing home facilities, government administration and – in more recent years – hospital care and national health expenditures on the whole. The only type of health expenditure with slower growth from 2012 through 2021 was physician and clinical services.
While prescription drug prices are increasing slower than other types of health spending in recent years, and while prescription drug spending is still a fraction of total health spending in the U.S., there is no doubt that some Americans struggle to pay for their medications.
A fall 2021 Kaiser Family Foundation (KFF) Health Tracking Poll found that roughly 16 percent of Americans – or one in six – said it was difficult to afford the cost of their prescription medicine, or 26 percent of Americans who take any medications.[12]
IQVIA found the same percentage of Medicare beneficiaries (16 percent) had out-of-pocket costs exceeding $500 in 2021, compared to seven percent of patients (or one in 14) with over $500 in out-of-pocket costs in commercial insurance.
Furthermore, while federal health programs are picking up a growing portion of the tab for prescription drugs – Medicare and Medicaid covered 35 percent of prescription drug costs in 2013, and 42.2 percent in 2021 – consumers still covered about 13 percent of costs out-of-pocket in 2021, while private health insurance paid about as much as Medicare and Medicaid combined.[13]
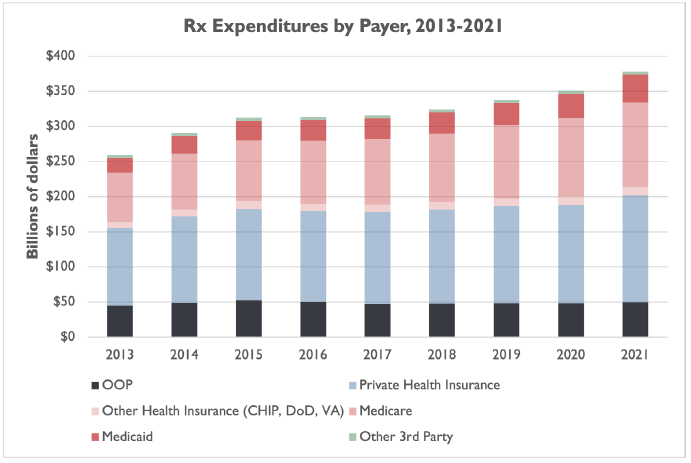
In other words, consumers are still exposed to out-of-pocket prescription drug costs in ways they are not for hospital spending, physician spending, and other types of health spending.
NTU has long advocated for narrow, taxpayer-friendly solutions to rising prescription drug costs. Solutions to assist the roughly eight percent of patients with over $500 in out-of-pocket costs (16 percent of Medicare patients, seven percent of commercially insured patients) should not undermine the 29 percent of patients who had $0 in out-of-pocket costs in 2021 and the more than 70 percent of patients who had less than $100 in out-of-pocket costs (chart via IQVIA):
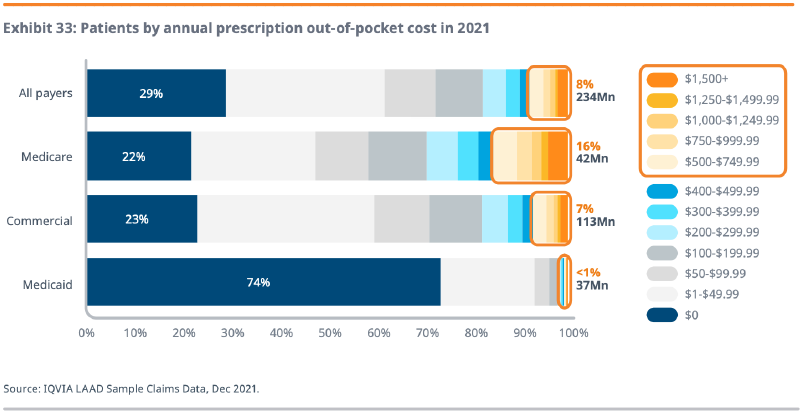
[Graphic via IQVIA]
As also noted in the body of this paper, the research and development processes for prescription drugs are among the most challenging of any economic sector.
According to CBO, in 2019 “[t]he pharmaceutical industry devoted $83 billion to R&D expenditures … about 10 times what the industry spent per year in the 1980s, after adjusting for the effects of inflation.”
This is more than double the federal government’s contributions to basic life sciences research through the National Institutes of Health (NIH), which was $41 billion in 2020, though as the non-partisan Congressional Research Service (CRS) has pointed out the federal government contributes to industry R&D in more indirect ways (including through the patent system and with federal subsidies to health coverage that can increase use of and demand for prescription drugs).
There are many more illustrations of the trend. The industry’s share of net revenues (not gross) devoted to R&D has also increased, according to CBO:
“On average, pharmaceutical companies spent about one-quarter of their revenues (net of expenses and buyer rebates) on R&D expenses in 2019, which is almost twice as large a share of revenues as they spent in 2000. … larger than that for other knowledge-based industries, such as semiconductors, technology hardware, and software.”
As noted by NTU and others, including CBO, prescription drug approval is also extremely difficult to achieve. According to Journals of the American College of Cardiology:
“Approximately 1 in 1,000 potential drugs is graduated to human clinical trials after pre-clinical testing in the United States, and almost 9 of every 10 new drugs then fails in the human testing phase.”
The pathway from pre-clinical testing to approval for new drugs typically takes about 12 years. Prescription drugs are priced in part due to this long approval timeline and to compensate for a manufacturer’s drug failures, which far outpace its success stories.
Or, as CBO wrote:
“Estimates, from multiple sources, of average R&D expenditures per new drug range from less than $1 billion to more than $2 billion. Those estimates all include capital costs as well as expenditures on drugs that did not make it to market.”
Further, and as noted in the introduction above, CBO finds that the next frontier of prescription drug R&D seems to be focused on the diseases and ailments that are most devastating to American lives and financial well-being – and most vexing to cure:
“Information about the kinds of drugs in current clinical trials indicates that much of the industry’s innovative activity is focused on specialty drugs that would provide new cancer therapies and treatments for nervous-system disorders, such as Alzheimer’s disease and Parkinson’s disease.”
This is the next frontier, and efforts so far to tackle complex and costly conditions like Alzheimer’s, cancer, and obesity have led to some list-price sticker shock.
Yet, it would be easy to react to such sticker shock in unproductive ways, i.e., price controls, one-sided forced “negotiations” over pricing, heavier taxes, more regulatory interference, or inefficient government spending programs.
Instead, policy proposals should actually support market-based competition rather than undermining competition, prescription drug R&D, and product innovation, because R&D and product innovation have a proven track record of delivering trillions of dollars in economic gains to the American public.
[1] See data from CBO here, May 2022 “Historical Budget Data,” column titled “1. Rev, Outlays, Surplus, Debt.” Total federal government spending not adjusted for inflation.
[2] According to an April 2021 CBO report, industry spent $83 billion on R&D in 2019 while National Institutes of Health (NIH) funding was only $41 billion in fiscal year 2020. This is not necessarily an apples-apples comparison, and excludes the effect that other federal spending on health programs and subsidies has on pharmaceutical research – as well the effects of federal tax and regulatory policies. However, the comparison indicates there is a significant gap between private-sector funding for pharmaceutical research and development (R&D) and federal funding for basic research. Read the full report here.
[3] See page 74 of this April 2022 Government Accountability Office (GAO) report. GAO includes in their measure of “Vaccines” funding: development, procurement, research, distribution, administration, and technical assistance. GAO measures allocations (from the parent agency, Health and Human Services, to various sub-agencies and departments), obligations (commitments by agencies and sub-agencies to spend federal dollars), and expenditures (when those commitments are actually fulfilled and paid for) for the “Vaccines” category and others. NTU uses the Obligations figure above. Allocations as of February 28, 2022 were $41.5 billion. Expenditures were only $17.7 billion.
[4] $37.3 billion / 224.9 taxpayers (in fiscal year 2021). For more, see Department of Defense Cost of War reporting here.
[5] CDC’s website cites a number of studies regarding obesity and COVID, including:
- Tanaka, S. I., Isoda, F., Ishihara, Y., Kimura, M., & Yamakawa, T. (2001). T lymphopaenia in relation to body mass index and TNF‐α in human obesity: adequate weight reduction can be corrective. Clinical endocrinology, 54(3), 347-354.
- Alwarawrah, Y., Kiernan, K., & MacIver, N. J. (2018). Changes in nutritional status impact immune cell metabolism and function. Frontiers in immunology, 9, 1055.
- Simonnet, A., Chetboun, M., Poissy, J., Raverdy, V., Noulette, J., Duhamel, A., … & LICORN and the Lille COVID‐19 and Obesity study group. (2020). High prevalence of obesity in severe acute respiratory syndrome coronavirus‐2 (SARS‐CoV‐2) requiring invasive mechanical ventilation. Obesity.
- Kompaniyets L, Goodman AB, Belay B, et al. Body Mass Index and Risk for COVID-19–Related Hospitalization, Intensive Care Unit Admission, Invasive Mechanical Ventilation, and Death — United States, March–December 2020. (2021). MMWR Morb Mortal Wkly Rep 2021;70:355–361.
- O’Hearn M, Liu J, Cudhea F, Micha R, Mozaffarian D. (2021). Coronavirus Disease 2019 Hospitalizations Attributable to Cardiometabolic Conditions in the United States: A Comparative Risk Assessment Analysis. Journal of the American Heart Association. 2021 Feb;10(5):e019259.
- Kompaniyets, Lyudmyla, et al. “Underlying medical conditions associated with severe COVID-19 illness among children.” JAMA network open 4.6 (2021).
[6] See: Wakely Consulting Group. “State of New Mexico, Office of the Superintendent of Insurance Benchmark Plan Benefit Valuation Report,” March 9, 2020. Retrieved from: https://www.osi.state.nm.us/wp-content/uploads/2020/03/2022-Essential-Health-Benefits-EHB-Actuarial-Report.pdf
[7] This estimate includes the medical expenses of overweight individuals – not just obese individuals – but also excludes indirect medical expenses and economic costs of obesity.
[8] See, for example, an April 7, 2022 Centers for Medicare and Medicaid decision to limit federal reimbursement for an Alzheimer’s treatment the FDA approved in 2021: https://www.cms.gov/newsroom/press-releases/cms-finalizes-medicare-coverage-policy-monoclonal-antibodies-directed-against-amyloid-treatment
[9] One example whose approach could be replicated is the Promising Pathway Act (S.1644 from Sen. Mike Braun (R-IN) and H.R.3761 from Rep. Mike Gallagher (R-WI) in the 117th Congress), which would “[establish] a [two-year] provisional approval pathway for medicines intended for serious or life-threatening diseases, including illnesses posing a threat of epidemic or pandemic.”
[10] Note that, due to gaps in Centers for Medicare and Medicaid Services (CMS) data, our chart only presents CMS data from 2000 through 2021. CMS presents estimates for the years 1970, 1980, and 1990 only, before presenting data for each year from 2000 through 2021.
[11] We exclude 2020 and 2021 in this case, given the COVID-19 pandemic likely had an outsized effect on hospital spending growth in 2020 and 2021.
[12] In other words, of the 62 percent of American adults who take at least one prescription medication, 26 percent reported difficulty affording the cost of their medicine: 62 percent * 0.26 = 16 percent of all adults.
[13] There is a significant difference between CMS and IQVIA measures of the scale of out-of-pocket spending on prescription drugs. CMS measures around $49.8 billion in 2021, while IQVIA measures around $79 billion in 2021. It is unclear, based on IQVIA and CMS methodology, what accounts for the difference, but both institutions report roughly the same proportion of prescription drug spending paid by consumers out of pocket, around 13 percent.