
 Every year National Taxpayers Union (NTU) rates U.S. Representatives and Senators on their actual votes—every vote that affects taxes, spending, and debt. Unlike most organizations that publish ratings, we refuse to play the “rating game” of focusing on only a handful of congressional votes on selected issues. The NTU voting study is the fairest and most accurate guide available on congressional spending.
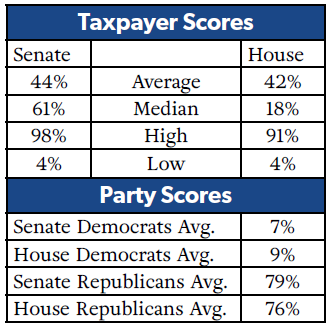
NTU has no partisan ax to grind. All members of Congress are treated the same regardless of political affiliation. Our only constituency is the overburdened American taxpayer. Grades are given impartially, based on the Taxpayer Score.
Taxpayer Score
The Taxpayer Score measures the strength of support for reducing wasteful government spending, opposing higher taxes, and often opposing burdensome regulations that can stifle U.S. economic growth. In general, a higher score is better because it means a member of Congress voted to spend less money.
The Taxpayer Score can range between zero and 100. We do not expect anyone to score a 100, nor has any legislator ever scored a perfect 100—without missing a single vote—in the decades-long history of the comprehensive NTU scoring system. A high score does not mean that the member of Congress was opposed to all spending or all programs. High-scoring members have indicated that they would vote for many programs if the amount of spending were lower or if the spending were offset by cuts elsewhere in the budget. Indeed, a member who still wants to increase spending on some programs can achieve a high score if he or she votes for offsetting cuts. A zero score would indicate that the member of Congress approved every spending increase and opposed every pro-taxpayer reform.
- Click here for the PDF publication of NTU Rates Congress for the first session of the 117th Congress.
- To view the list of votes used to establish the NTU Ratings, click here.
Senate
Alabama | Kentucky | North Dakota | ||||||
Shelby | 81% | B | McConnell | 66% | C+ | Cramer | 76% | B- |
Tuberville | 89% | B+ | Paul | 97% | A | Hoeven | 77% | B- |
State Average | 85% | State Average | 82% | State Average | 77% | |||
Alaska | Louisiana | Ohio | ||||||
Murkowski | 61% | C | Cassidy | 77% | B- | Brown | 7% | F |
Sullivan | 63% | C | Kennedy | 84% | B | Portman | 67% | C+ |
State Average | 62% | State Average | 81% | State Average | 37% | |||
Arizona | Maine | Oklahoma | ||||||
Kelly | 8% | F | Collins | 62% | C | Inhofe | 80% | B |
Sinema | 12% | F | King | 9% | F | Lankford | 89% | B+ |
State Average | 10% | State Average | 36% | State Average | 85% | |||
Arkansas | Maryland | Oregon | ||||||
Boozman | 83% | B | Cardin | 6% | F | Merkley | 10% | F |
Cotton | 83% | B | Van Hollen | 4% | F | Wyden | 10% | F |
State Average | 83% | State Average | 5% | State Average | 10% | |||
California | Massachusetts | Pennsylvania | ||||||
Feinstein | 7% | F | Markey | 8% | F | Casey | 6% | F |
Padilla | 9% | F | Warren | 7% | F | Toomey | 89% | B+ |
State Average | 8% | State Average | 8% | State Average | 48% | |||
Colorado | Michigan | Rhode Island | ||||||
Bennet | 6% | F | Peters | 6% | F | Reed | 5% | F |
Hickenlooper | 7% | F | Stabenow | 6% | F | Whitehouse | 4% | F |
State Average | 7% | State Average | 6% | State Average | 5% | |||
Connecticut | Minnesota | South Carolina | ||||||
Blumenthal | 6% | F | Klobuchar | 7% | F | Graham | 67% | C+ |
Murphy | 6% | F | Smith | 7% | F | Scott, T. | 85% | B+ |
State Average | 6% | State Average | 7% | State Average | 76% | |||
Delaware | Mississippi | South Dakota | ||||||
Carper | 9% | F | Hyde-Smith | 83% | B | Rounds | 66% | C+ |
Coons | 9% | F | Wicker | 69% | C+ | Thune | 81% | B |
State Average | 9% | State Average | 76% | State Average | 74% | |||
Florida | Missouri | Tennessee | ||||||
Rubio | 80% | B | Blunt | 62% | C | Blackburn | 86% | B+ |
Scott, R. | 85% | B+ | Hawley | 82% | B | Hagerty | 87% | B+ |
State Average | 83% | State Average | 72% | State Average | 87% | |||
Georgia | Montana | Texas | ||||||
Ossoff | 6% | F | Daines | 82% | B | Cornyn | 78% | B- |
Warnock | 6% | F | Tester | 11% | F | Cruz | 92% | A |
State Average | 6% | State Average | 47% | State Average | 85% | |||
Hawaii | Nebraska | Utah | ||||||
Hirono | 6% | F | Fischer | 81% | B | Lee | 98% | A |
Schatz | 4% | F | Sasse | 80% | B | Romney | 64% | C |
State Average | 5% | State Average | 81% | State Average | 81% | |||
Idaho | Nevada | Vermont | ||||||
Crapo | 77% | B- | Cortez Masto | 7% | F | Leahy | 6% | F |
Risch | 77% | B- | Rosen | 7% | F | Sanders | 14% | F |
State Average | 77% | State Average | 7% | State Average | 10% | |||
Illinois | New Hampshire | Virginia | ||||||
Duckworth | 7% | F | Hassan | 11% | F | Kaine | 6% | F |
Durbin | 6% | F | Shaheen | 10% | F | Warner | 6% | F |
State Average | 7% | State Average | 11% | State Average | 6% | |||
Indiana | New Jersey | Washington | ||||||
Braun | 94% | A | Booker | 6% | F | Cantwell | 5% | F |
Young | 71% | C+ | Menendez | 6% | F | Murray | 5% | F |
State Average | 83% | State Average | 6% | State Average | 5% | |||
Iowa | New Mexico | West Virginia | ||||||
Ernst | 86% | B+ | Heinrich | 5% | F | Capito | 64% | C |
Grassley | 79% | B- | Lujan | 7% | F | Manchin | 14% | F |
State Average | 83% | State Average | 6% | State Average | 39% | |||
Kansas | New York | Wisconsin | ||||||
Marshall | 86% | B+ | Gillibrand | 9% | F | Baldwin | 7% | F |
Moran | 85% | B+ | Schumer | N/A | N/A | Johnson | 90% | A |
State Average | 86% | State Average | 9% | State Average | 49% | |||
North Carolina | Wyoming | |||||||
Burr | 71% | C+ | Barrasso | 86% | B+ | |||
Tillis | 67% | C+ | Lummis | 91% | A | |||
State Average | 69% | State Average | 89% |
House
Alabama | Indiana | North Dakota | ||||||
Aderholt | 78% | B- | Baird | 74% | C+ | Armstrong | 78% | B- |
Brooks | 84% | B | Banks | 81% | B | State Average | 78% | |
Carl | 78% | B- | Bucshon | 74% | C+ | Ohio | ||
Moore, B. | 82% | B | Carson | 8% | F | Balderson | 75% | B- |
Palmer | 81% | B | Hollingsworth | 74% | C+ | Beatty | 9% | F |
Rogers, M. | 75% | B- | Mrvan | 8% | F | Brown, S. | N/A | N/A |
Sewell | 9% | F | Pence | 78% | B- | Carey | N/A | N/A |
State Average | 70% | Spartz | 76% | B- | Chabot | 76% | B- | |
Alaska | Walorski | 74% | C+ | Davidson | 82% | B | ||
Young | 63% | C | State Average | 61% | Gibbs | 77% | B- | |
State Average | 63% | Iowa | Gonzalez, A. | 64% | C | |||
Arizona | Axne | 6% | F | Johnson, B. | 72% | C+ | ||
Biggs | 87% | B+ | Feenstra | 74% | C+ | Jordan | 88% | B+ |
Gallego | 8% | F | Hinson | 74% | C+ | Joyce, D. | 68% | C+ |
Gosar | 87% | B+ | Miller-Meeks | 71% | C+ | Kaptur | 6% | F |
Grijalva | 10% | F | State Average | 56% | Latta | 75% | B- | |
Kirkpatrick | 6% | F | Kansas | Ryan | 6% | F | ||
Lesko | 86% | B+ | Davids | 6% | F | Turner | 72% | C+ |
O'Halleran | 5% | F | Estes | 85% | B+ | Wenstrup | 75% | B- |
Schweikert | 83% | B | Laturner | 76% | B- | State Average | 60% | |
Stanton | 5% | F | Mann | 82% | B | Oklahoma | ||
State Average | 42% | State Average | 62% | Bice | 75% | B- | ||
Arkansas | Kentucky | Cole | 71% | C+ | ||||
Crawford | 77% | B- | Barr | 75% | B- | Hern | 85% | B+ |
Hill | 74% | C+ | Comer | 79% | B- | Lucas | 72% | C+ |
Westerman | 76% | B- | Guthrie | 74% | C+ | Mullin | 76% | B- |
Womack | 73% | C+ | Massie | 91% | A | State Average | 76% | |
State Average | 75% | Rogers, H. | 70% | C+ | Oregon | |||
California | Yarmuth | 9% | F | Bentz | 72% | C+ | ||
Aguilar | 8% | F | State Average | 66% | Blumenauer | 11% | F | |
Barragan | 10% | F | Louisiana | Bonamici | 12% | F | ||
Bass | 9% | F | Carter, T. | 7% | F | DeFazio | 13% | F |
Bera | 8% | F | Graves, G. | 73% | C+ | Schrader | 18% | F |
Brownley | 5% | F | Higgins, C. | 83% | B | State Average | 25% | |
Calvert | 73% | C+ | Johnson, M. | 79% | B- | Pennsylvania | ||
Carbajal | 8% | F | Letlow | 64% | C | Boyle | 7% | F |
Cardenas | 9% | F | Scalise | 75% | B- | Cartwright | 7% | F |
Chu | 11% | F | State Average | 64% | Dean | 8% | F | |
Correa | 8% | F | Maine | Doyle | 13% | F | ||
Costa | 6% | F | Golden | 33% | D | Evans | 9% | F |
DeSaulnier | 10% | F | Pingree | 8% | F | Fitzpatrick | 49% | C- |
Eshoo | 10% | F | State Average | 21% | Houlahan | 7% | F | |
Garamendi | 10% | F | Maryland | Joyce, J. | 75% | B- | ||
Garcia, M. | 72% | C+ | Brown, A. | 7% | F | Keller | 76% | B- |
Gomez | 12% | F | Harris | 85% | B+ | Kelly, M. | 75% | B- |
Harder | 8% | F | Hoyer | 8% | F | Lamb | 6% | F |
Huffman | 11% | F | Mfume | 10% | F | Meuser | 75% | B- |
Issa | 74% | C+ | Raskin | 11% | F | Perry | 86% | B+ |
Jacobs, S. | 11% | F | Ruppersberger | 7% | F | Reschenthaler | 71% | C+ |
Khanna | 12% | F | Sarbanes | 9% | F | Scanlon | 7% | F |
Kim, Y. | 69% | C+ | Trone | 4% | F | Smucker | 74% | C+ |
LaMalfa | 75% | B- | State Average | 18% | Thompson, G. | 71% | C+ | |
Lee, B. | 13% | F | Massachusetts | Wild | 6% | F | ||
Levin, M. | 6% | F | Auchincloss | 12% | F | State Average | 40% | |
Lieu | 9% | F | Clark | 11% | F | Rhode Island | ||
Lofgren | 10% | F | Keating | 5% | F | Cicilline | 9% | F |
Lowenthal | 11% | F | Lynch | 6% | F | Langevin | 5% | F |
Matsui | 10% | F | McGovern | 12% | F | State Average | 7% | |
McCarthy | 74% | C+ | Moulton | 6% | F | South Carolina | ||
McClintock | 89% | B+ | Neal | 6% | F | Clyburn | 8% | F |
McNerney | 10% | F | Pressley | 17% | F | Duncan | 84% | B |
Napolitano | 9% | F | Trahan | 9% | F | Mace | 77% | B- |
Nunes | 73% | C+ | State Average | 9% | Norman | 90% | A | |
Obernolte | 73% | C+ | Michigan | Rice, T. | 82% | B | ||
Panetta | 7% | F | Bergman | 74% | C+ | Timmons | 79% | B- |
Pelosi | N/A | N/A | Dingell | 10% | F | Wilson, J. | 75% | B- |
Peters | 6% | F | Huizenga | 78% | B- | State Average | 71% | |
Porter | 11% | F | Kildee | 11% | F | South Dakota | ||
Roybal-Allard | 8% | F | Lawrence | 10% | F | Johnson, D. | 75% | B- |
Ruiz | 7% | F | Levin, A. | 12% | F | State Average | 75% | |
Sanchez | 10% | F | McClain | 75% | B- | Tennessee | ||
Schiff | 10% | F | Meijer | 69% | C+ | Burchett | 84% | B |
Sherman | 8% | F | Moolenaar | 74% | C+ | Cohen | 12% | F |
Speier | 8% | F | Slotkin | 6% | F | Cooper | 8% | F |
Steel | 74% | C+ | Stevens | 7% | F | Desjarlais | 79% | B- |
Swalwell | 7% | F | Tlaib | 18% | F | Fleischmann | 73% | C+ |
Takano | 11% | F | Upton | 61% | C | Green, M. | 79% | B- |
Thompson | 9% | F | Walberg | 78% | B- | Harshbarger | 80% | B |
Torres, N. | 6% | F | State Average | 42% | Kustoff | 75% | B- | |
Valadao | 68% | C+ | Minnesota | Rose | 81% | B | ||
Vargas | 10% | F | Craig | 6% | F | State Average | 63% | |
Waters | 10% | F | Emmer | 74% | C+ | Texas | ||
State Average | 23% | Fischbach | 76% | B- | Allred | 6% | F | |
Colorado | Hagedorn | 76% | B- | Arrington | 85% | B+ | ||
Boebert | 89% | B+ | McCollum | 8% | F | Babin | 81% | B |
Buck | 87% | B+ | Omar | 17% | F | Brady | 78% | B- |
Crow | 7% | F | Phillips | 8% | F | Burgess | 81% | B |
Degette | 10% | F | Stauber | 68% | C+ | Carter, J. | 74% | C+ |
Lamborn | 77% | B- | State Average | 42% | Castro | 9% | F | |
Neguse | 11% | F | Mississippi | Cloud | 85% | B+ | ||
Perlmutter | 6% | F | Guest | 81% | B | Crenshaw | 76% | B- |
State Average | 41% | Kelly, T. | 79% | B- | Cuellar | 12% | F | |
Connecticut | Palazzo | 79% | B- | Doggett | 10% | F | ||
Courtney | 6% | F | Thompson, B. | 9% | F | Ellzey | N/A | N/A |
DeLauro | 8% | F | State Average | 62% | Escobar | 10% | F | |
Hayes | 10% | F | Missouri | Fallon | 80% | B | ||
Himes | 8% | F | Bush | 19% | F | Fletcher | 6% | F |
Larson | 5% | F | Cleaver | 8% | F | Garcia, S. | 8% | F |
State Average | 7% | Graves, S. | 74% | C+ | Gohmert | 84% | B | |
Delaware | Hartzler | 77% | B- | Gonzales | 70% | C+ | ||
Blunt Rochester | 9% | F | Long | 75% | B- | Gonzalez, V. | 6% | F |
State Average | 9% | Luetkemeyer | 75% | B- | Gooden | 85% | B+ | |
Florida | Smith, J. | 78% | B- | Granger | 73% | C+ | ||
Bilirakis | 72% | C+ | Wagner | 73% | C+ | Green, A. | 9% | F |
Buchanan | 72% | C+ | State Average | 60% | Jackson | 81% | B | |
Cammack | 83% | B | Montana | Jackson Lee | 9% | F | ||
Castor | 9% | F | Rosendale | 88% | B+ | Johnson, E. | 9% | F |
Crist | 6% | F | State Average | 88% | McCaul | 72% | C+ | |
Demings | 6% | F | Nebraska | Nehls | 79% | B- | ||
Deutch | 8% | F | Bacon | 65% | C+ | Pfluger | 79% | B- |
Diaz-Balart | 67% | C+ | Fortenberry | 69% | C+ | Roy | 89% | B+ |
Donalds | 87% | B+ | Smith, Adrian | 75% | B- | Sessions | 81% | B |
Dunn | 74% | C+ | State Average | 70% | Taylor | 86% | B+ | |
Frankel | 9% | F | Nevada | Van Duyne | 77% | B- | ||
Franklin | 76% | B- | Amodei | 73% | C+ | Veasey | 5% | F |
Gaetz | 85% | B+ | Horsford | 6% | F | Vela | 6% | F |
Gimenez | 66% | C+ | Lee, S. | 7% | F | Weber | 86% | B+ |
Lawson | 9% | F | Titus | 9% | F | Williams, R. | 76% | B- |
Mast | 81% | B | State Average | 24% | State Average | 53% | ||
Murphy, S. | 6% | F | New Hampshire | Utah | ||||
Posey | 82% | B | Kuster | 8% | F | Curtis | 77% | B- |
Rutherford | 77% | B- | Pappas | 6% | F | Moore | 75% | B- |
Salazar | 65% | C+ | State Average | 7% | Owens | 76% | B- | |
Soto | 6% | F | New Jersey | Stewart | 79% | B- | ||
Steube | 85% | B+ | Gottheimer | 6% | F | State Average | 77% | |
Waltz | 76% | B- | Kim, A. | 6% | F | Vermont | ||
Wasserman Schultz | 6% | F | Malinowski | 10% | F | Welch | 12% | F |
Webster | 78% | B- | Norcross | 5% | F | State Average | 12% | |
Wilson, F. | 10% | F | Pallone | 12% | F | Virginia | ||
State Average | 50% | Pascrell | 8% | F | Beyer | 9% | F | |
Georgia | Payne | 11% | F | Cline | 84% | B | ||
Allen | 81% | B | Sherrill | 6% | F | Connolly | 9% | F |
Bishop, S. | 6% | F | Sires | 6% | F | Good | 89% | B+ |
Bourdeaux | 6% | F | Smith | 53% | C | Griffith | 81% | B |
Carter, B. | 76% | B- | Van Drew | 59% | C | Luria | 7% | F |
Clyde | 87% | B+ | Watson Coleman | 12% | F | McEachin | 5% | F |
Ferguson | 79% | B- | State Average | 16% | Scott, B. | 7% | F | |
Greene | 89% | B+ | New Mexico | Spanberger | 6% | F | ||
Hice | 87% | B+ | Herrell | 86% | B+ | Wexton | 7% | F |
Johnson, H. | 11% | F | Leger Fernandez | 10% | F | Wittman | 75% | B- |
Loudermilk | 85% | B+ | Stansbury | 11% | F | State Average | 34% | |
McBath | 7% | F | State Average | 36% | Washington | |||
Scott, A. | 76% | B- | New York | Delbene | 8% | F | ||
Scott, D. | 6% | F | Bowman | 16% | F | Herrera Beutler | 69% | C+ |
Williams, N. | 11% | F | Clarke | 11% | F | Jayapal | 12% | F |
State Average | 51% | Delgado | 6% | F | Kilmer | 8% | F | |
Hawaii | Espaillat | 11% | F | Larsen | 8% | F | ||
Case | 7% | F | Garbarino | 63% | C | McMorris Rodgers | 73% | C+ |
Kahele | 5% | F | Higgins, B. | 6% | F | Newhouse | 66% | C+ |
State Average | 6% | Jacobs, C. | 70% | C+ | Schrier | 6% | F | |
Idaho | Jeffries | 9% | F | Smith, Adam | 9% | F | ||
Fulcher | 81% | B | Jones | 13% | F | Strickland | 7% | F |
Simpson | 70% | C+ | Katko | 56% | C | State Average | 27% | |
State Average | 76% | Malliotakis | 65% | C+ | West Virginia | |||
Illinois | Maloney, C. | 12% | F | McKinley | 65% | C+ | ||
Bost | 67% | C+ | Maloney, S. | 6% | F | Miller, C. | 76% | B- |
Bustos | 5% | F | Meeks | 8% | F | Mooney | 80% | B |
Casten | 9% | F | Meng | 12% | F | State Average | 74% | |
Davis, D. | 12% | F | Morelle | 8% | F | Wisconsin | ||
Davis,R. | 66% | C+ | Nadler | 10% | F | Fitzgerald | 79% | B- |
Foster | 8% | F | Ocasio-Cortez | 17% | F | Gallagher | 75% | B- |
Garcia, C. | 13% | F | Reed | 67% | C+ | Grothman | 83% | B |
Kelly, R. | 9% | F | Rice, K. | 7% | F | Kind | 8% | F |
Kinzinger | 62% | C | Stefanik | 72% | C+ | Moore, G. | 12% | F |
Krishnamoorthi | 8% | F | Suozzi | 6% | F | Pocan | 12% | F |
LaHood | 74% | C+ | Tenney | 70% | C+ | Steil | 74% | C+ |
Miller, M. | 88% | B+ | Tonko | 10% | F | Tiffany | 81% | B |
Newman | 10% | F | Torres | 12% | F | State Average | 53% | |
Quigley | 8% | F | Velazquez | 11% | F | Wyoming | ||
Rush | 10% | F | Zeldin | 72% | C+ | Cheney | 72% | C+ |
Schakowsky | 12% | F | State Average | 27% | State Average | 72% | ||
Schneider | 6% | F | North Carolina | |||||
Underwood | 7% | F | Adams | 8% | F | |||
State Average | 26% | Bishop, D. | 87% | B+ | ||||
Budd | 84% | B | ||||||
Butterfield | 6% | F | ||||||
Cawthorn | 77% | B- | ||||||
Foxx | 81% | B | ||||||
Hudson | 75% | B- | ||||||
Manning | 7% | F | ||||||
McHenry | 72% | C+ | ||||||
Murphy, G. | 74% | C+ | ||||||
Price | 8% | F | ||||||
Ross | 6% | F | ||||||
Rouzer | 75% | B- | ||||||
State Average | 51% |
NTU’s federal budget experts assigned a weight to each roll call vote in the House and Senate. A low weight was assigned to votes that had relatively smaller effects on the size of the federal budget and federal deficits, the scale and scope of federal tax revenues, or the size and scope of the regulatory state. A high weight, on the other hand, was assigned to votes with the most significant effect on federal spending, deficits, taxes, or the size and scope of the regulatory state
Consideration was given to the longer-term effects of a vote on future fiscal policy, even if relatively few tax or deficit-financed dollars might be immediately at stake.
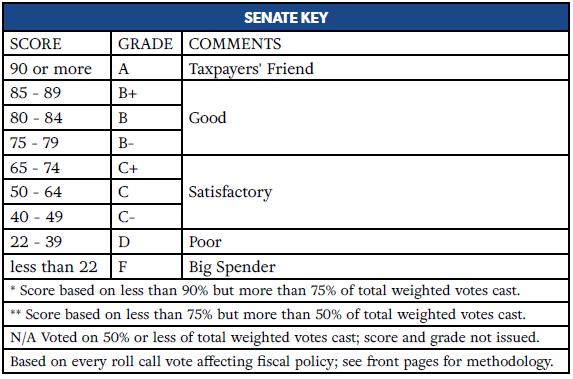
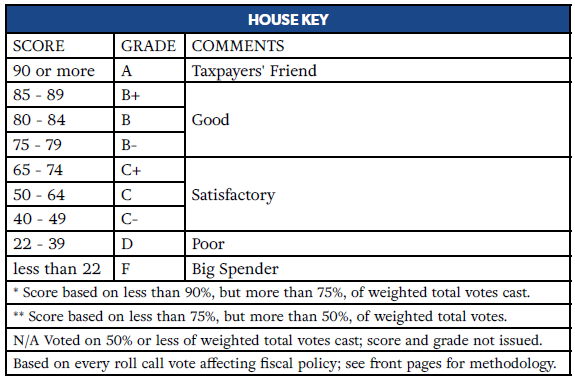
Scores were computed by dividing the weighted total of votes cast against higher spending or taxes (or for lower spending or taxes) by the weighted total number of spending and tax issues on which the member of Congress voted. Average scores for each state were also computed using the weighted total of votes cast by each state delegation.
In computing these scores, we included only those votes on which the member actually voted for or against a bill, resolution, or amendment. Announced positions and absences were excluded.
Additionally, because some members either missed votes frequently, cast certain votes to permit the usage of procedural tools, or otherwise abstained from voting yes or no, their scores may not accurately reflect spending attitudes. The members falling into this category are noted.
We analyzed every roll call vote taken in the First Session of the 117th Congress and selected all votes that could significantly affect the amounts of federal taxes, spending, debt, or regulatory impact. A total of 85 Senate and 121 House votes were selected.
We included votes cast on appropriations bills, authorization bills, budget resolutions, tax bills, amendments, and certain procedural and policy votes that could affect the burden on taxpayers. Votes that simply shifted equal amounts of spending from one area to another were excluded. Also excluded were unanimous votes and votes where there was a significant difference of opinion on how to vote to reduce or control the size of government.