(PDF) updated December 2024
Despite rhetoric to the contrary, the federal income tax system is highly progressive. Thanks to various exemptions, deductions, and credits, millions of Americans are shielded from significant income tax liability. New data from the IRS for Tax Year 2022 reveals that over 31% of all tax filers owed no federal income tax, a slight decrease from the elevated levels seen during the pandemic years when stimulus measures and expanded tax credits shielded even more taxpayers from liability.
For historical information: |
Nontaxable Returns in 2022
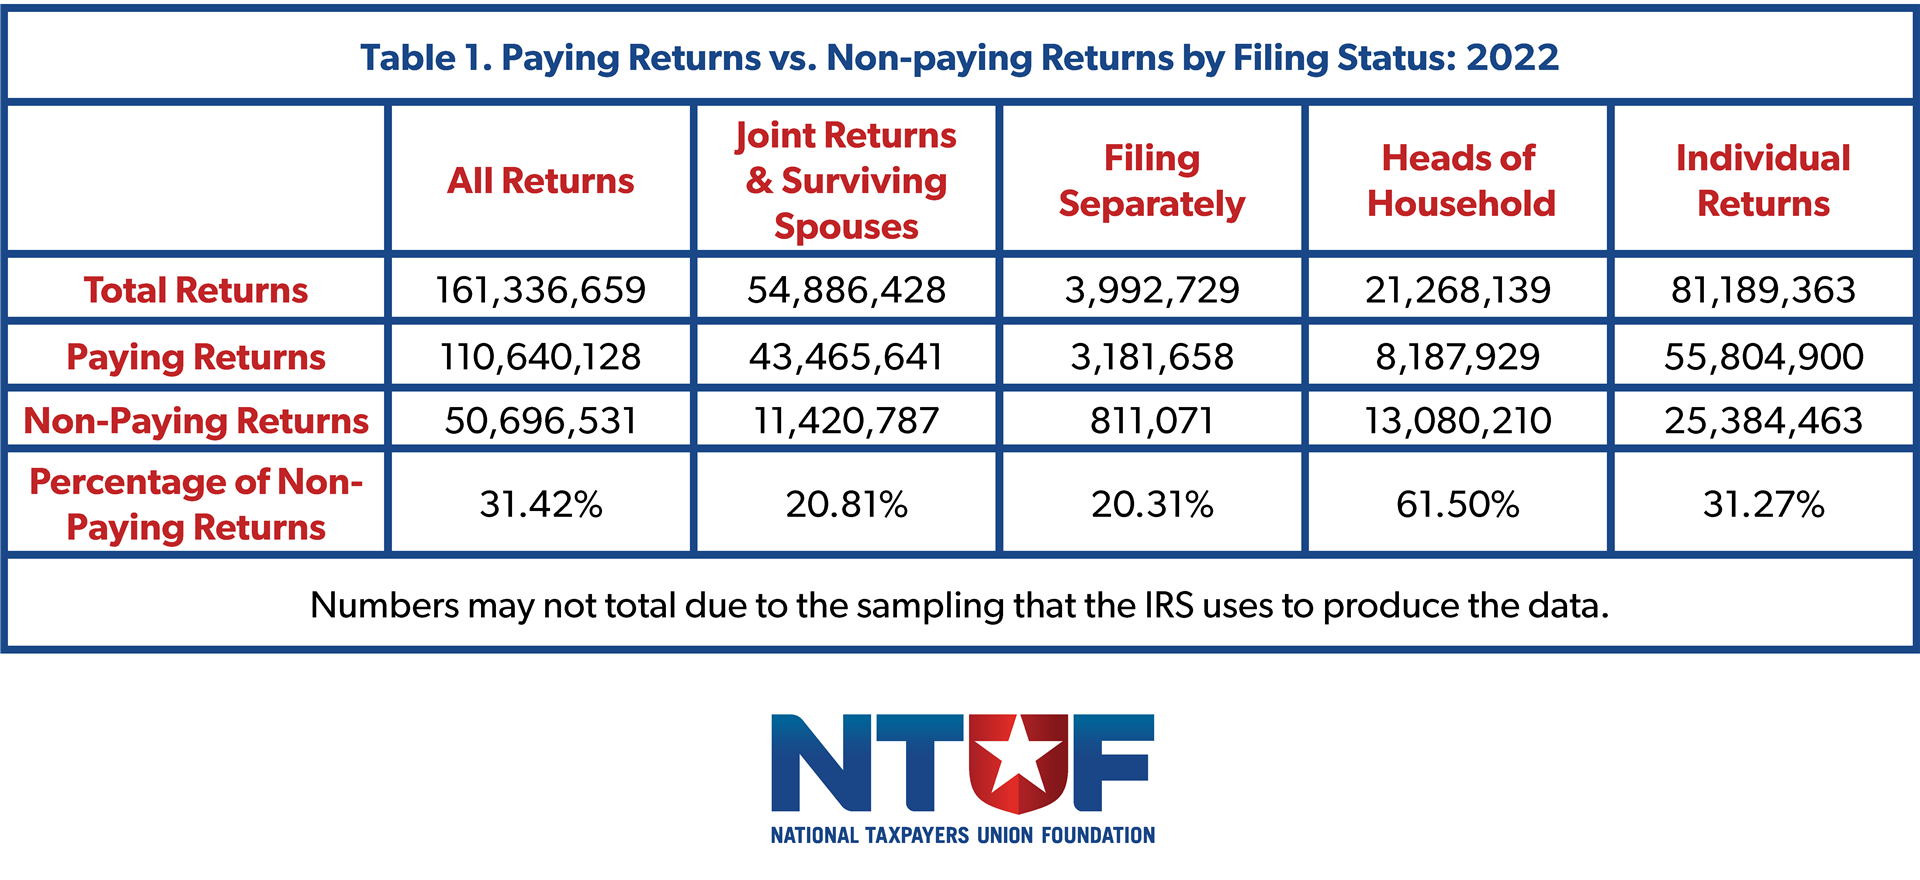
The IRS’s Statistics of Income division provides detailed data on the distribution of income tax liability across filing statuses. For Tax Year 2022, of the 161.3 million tax returns filed, approximately 50.7 million returns (or 31.42%) were classified as non-paying. Non-paying returns include filers whose earnings fell below taxable thresholds or who qualified for credits that offset their liabilities.
Breakdown by Filing Status:
- Joint Returns and Surviving Spouses: Among the 54.9 million joint returns filed, 11.4 million (or 20.81%) were non-paying. This group typically features higher combined incomes and benefits less frequently from income-based exemptions.
- Filing Separately: Of the 4 million returns filed under this status, 811,071 (or 20.31%) were non-paying. Filers in this category often have more limited access to certain deductions or credits compared to other statuses.
- Heads of Household: This group had the highest percentage of non-paying returns, with 61.5% of the 21.3 million returns filed owing no income tax. To file as head of household, a single individual must furnish over one-half of the costs of maintaining the household and have a qualifying child or dependent relative. The filing status allows for lower effective tax rates and a higher standard deduction than for single filers. These filers frequently benefit from income-based credits, including the Earned Income Tax Credit (EITC) and the Child Tax Credit (CTC).
- Individual Returns: Among the 81.2 million individual returns, 31.27% were non-paying. This reflects a mix of low-income individuals, part-time workers, and younger filers.
Historical Comparison
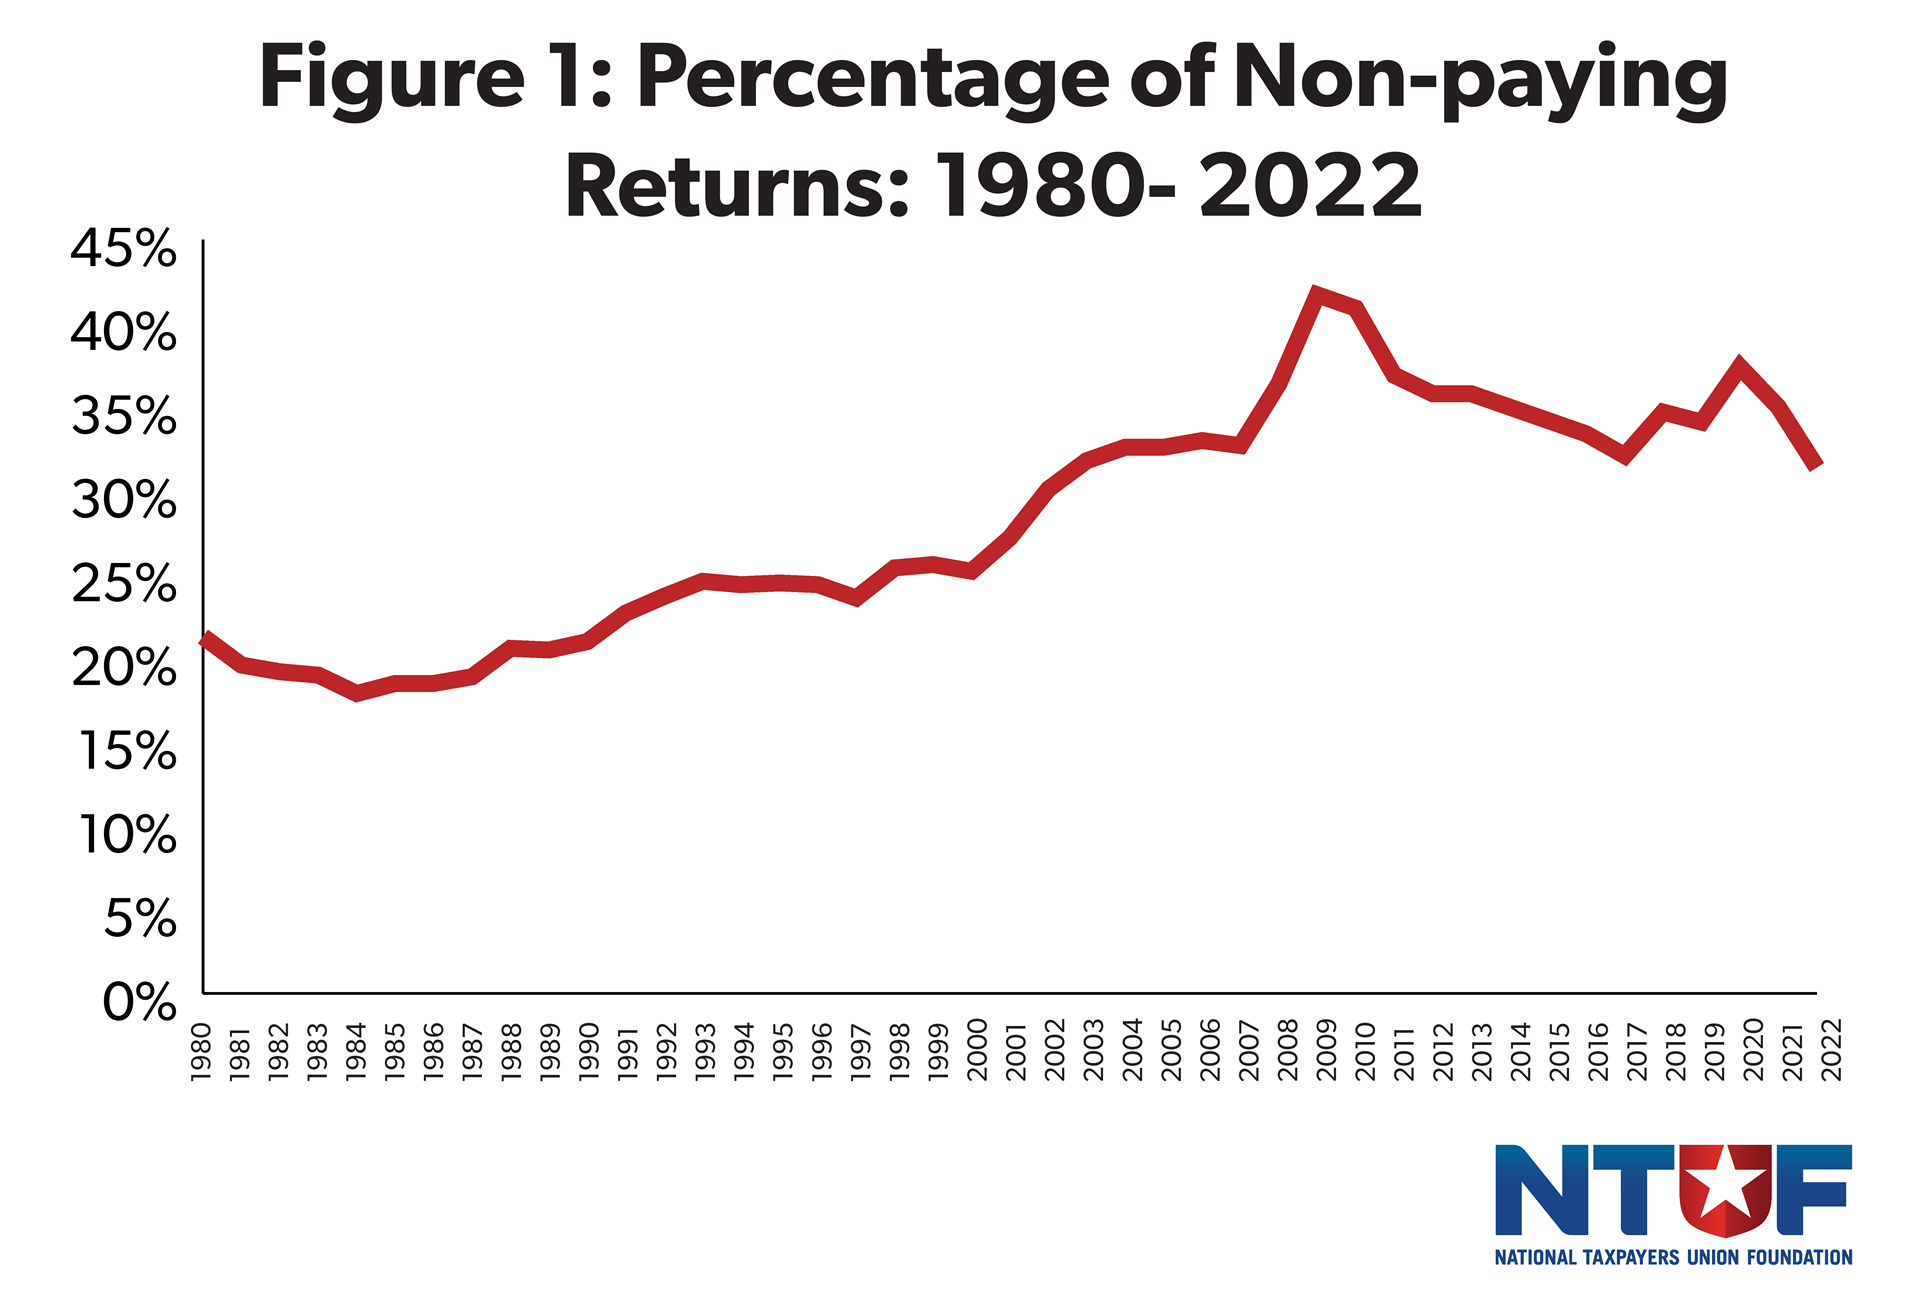
NTUF has collected IRS data on the levels of paying and non-paying tax returns since 1980. The number of returns owing no income tax decreased to 31.4% in 2022, down from 35.0% in 2021 and 37.4% in 2020, when the pandemic-driven economic contraction and expanded tax relief measures significantly increased the share of non-paying filers. Historically, the number of non-paying returns tends to rise during recessions and periods of high unemployment. Since data collection began in 1980, the highest recorded share of non-paying returns was 41.7% in 2009, during the aftermath of the Great Recession.
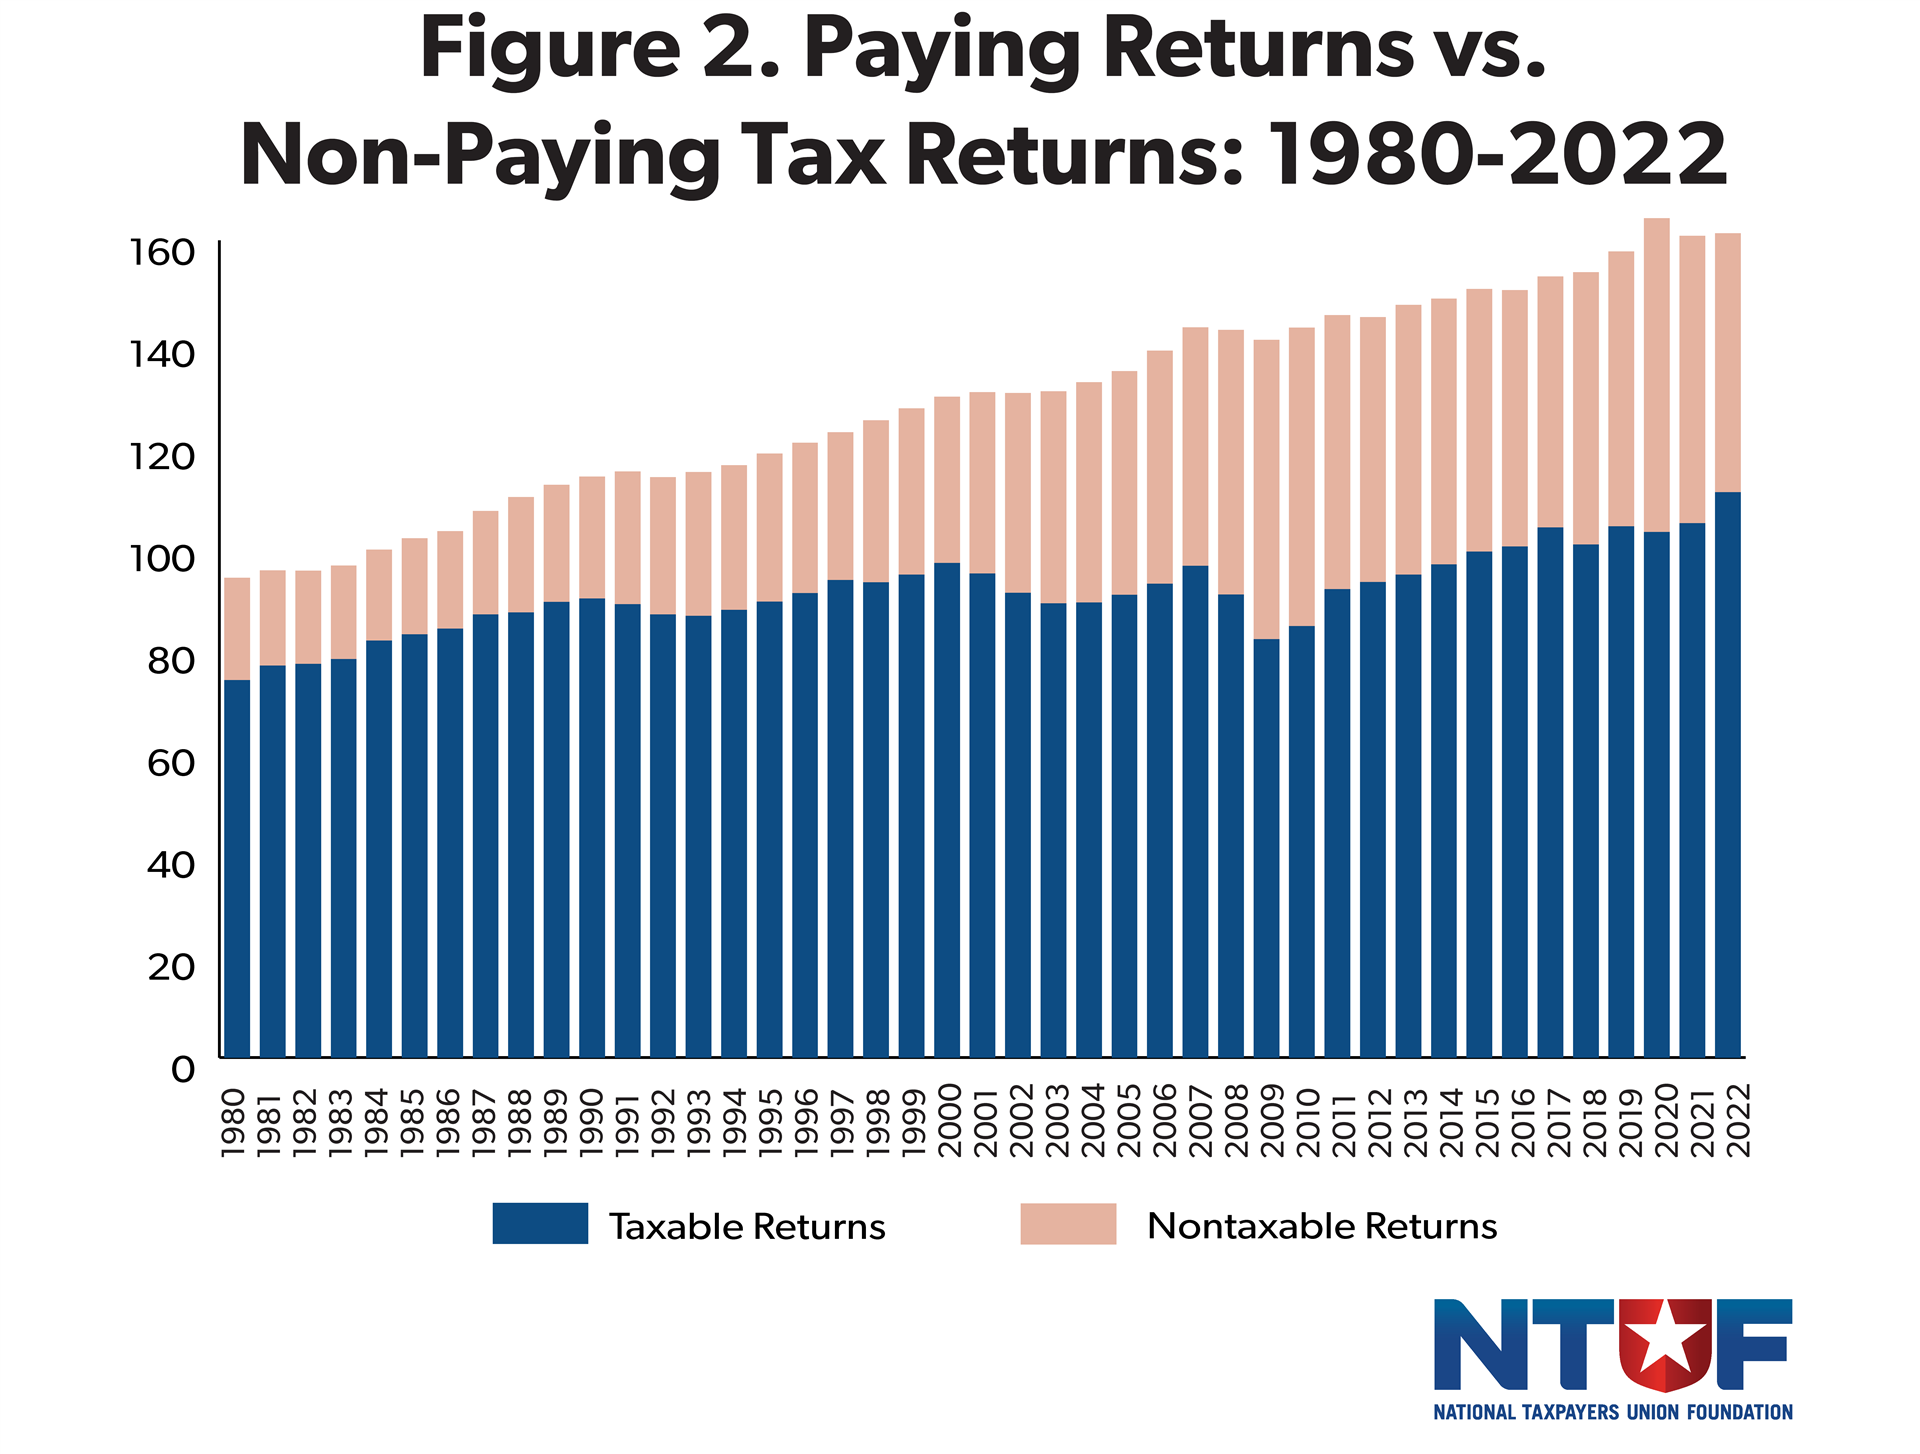
As shown in Figure 2, the total number of tax returns filed in 2022 was 161.3 million, a modest increase from 160.8 million in 2021. From 2000 to 2019, the number of returns filed increased by an annual average of 1.1%. However, in 2020, total returns spiked by 4%, from 157.8 million in 2019 to 164.4 million, largely due to the filing surge prompted by Economic Impact Payments under the Coronavirus Aid, Relief, and Economic Security Act.
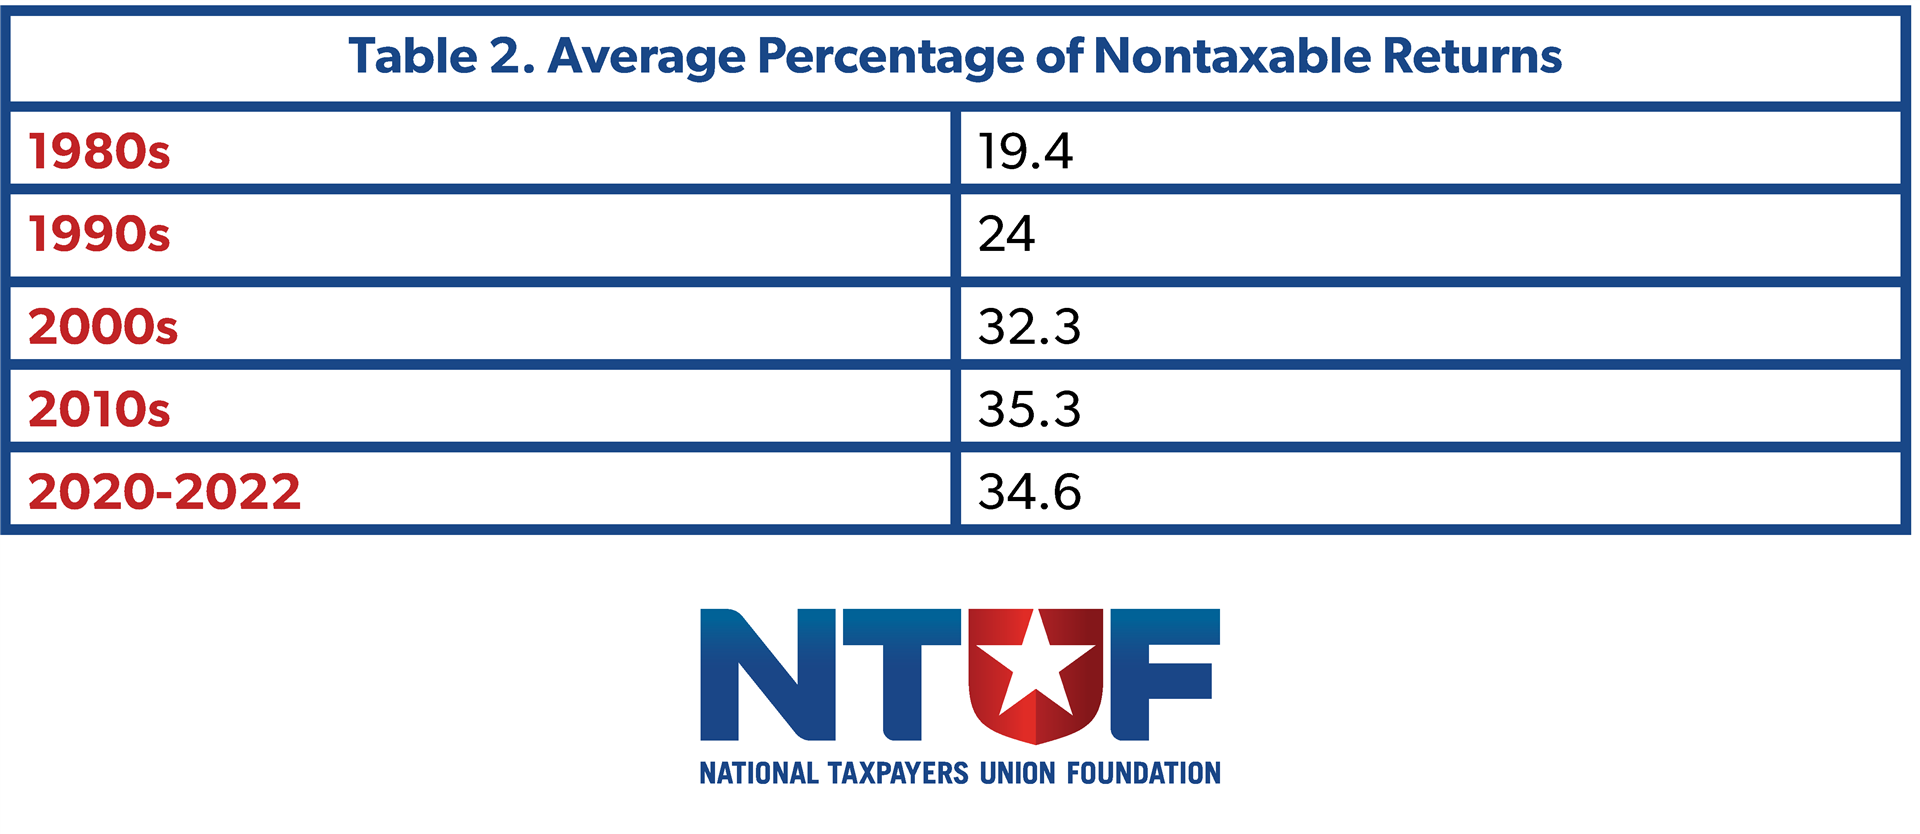
Over the decades, the trend of increasing numbers of non-paying returns reflects both economic fluctuations and policy changes aimed at providing relief to low-income households. During the 1980s, only 19.4% of returns were non-paying. By the 1990s, that figure had risen to 24.0%, and in the 2000s, it increased further to 32.3%. The 2010s saw another uptick to an average of 35.3%. Most recently, from 2020 through 2022, the average percentage age of non-paying returns slightly declined to 34.6%, reflecting a gradual return to pre-pandemic levels following a spike during the economic disruption of 2020.
Although the top federal income tax rate has dropped from 70% to below 40% over the past several decades, the federal tax code has grown increasingly progressive. In 1980, only about 20% of filers owed no income taxes, a figure that has risen to more than one-third today. NTUF’s annual Who Pays Income Taxes study, which tracks tax burdens since 1980, reveals that higher-income earners have consistently taken on a growing share of federal income taxes, while lower-income earners have become more insulated from substantial income tax obligations.
It should be noted that filers with no federal income tax liability often owe other taxes. Individuals earning wages are still subject to payroll taxes that fund Social Security and Medicare, which are assessed at a flat rate starting with the first dollar of income. Additionally, some non-paying returns may have been subject to other federal taxes, such as self-employment taxes. However, comprehensive analyses that account for these additional taxes consistently find that the overall federal tax system remains highly progressive.
Conclusion
As debates over the fairness of the tax code intensify ahead of the pending expiration of key provisions of the 2017 Tax Cuts and Jobs Act, it is crucial to ground discussions in the reality of how the system functions. The U.S. tax code is deliberately designed to be progressive, as evidenced by higher-income individuals shouldering a disproportionate share of the income tax burden, while lower-income earners are afforded significant relief.
As Congress revisits tax policy in 2025, lawmakers must strive to preserve a system that rewards productivity, supports economic growth, and provides opportunities for all Americans to thrive.