
(pdf)
Introduction
The newest Internal Revenue Service (IRS) data shows that over one-third of all filers had no income tax liability in 2019. This represents a modest decrease from 2018, which marked the first full year of implementation of the Tax Cuts and Jobs Act (TCJA). The biggest untold story of that tax reform legislation is that it increased the progressivity of the tax code. The nearly doubled standard deduction and the increased and expanded refundable child credit removed many filers from the income tax rolls. The change in 2019 largely resulted from the expanded economy and increased wages among middle income earners.
This new data further cements the trend that has seen the percentage of filers with no income liability generally increase from where it stood decades ago when one in five filers owed no income tax. This underscores the substantial progressivity of America’s income tax code, under which higher-income earners pay a larger share of taxes while low-income earners are generally shielded from significant income tax liabilities.
Nontaxable Returns
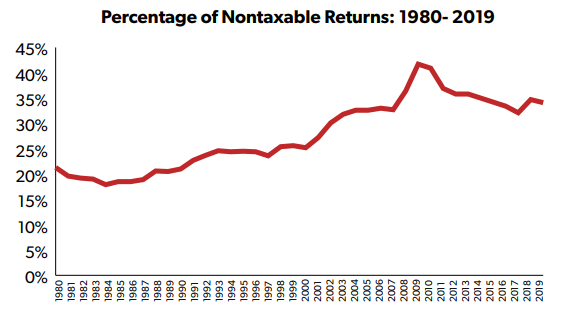
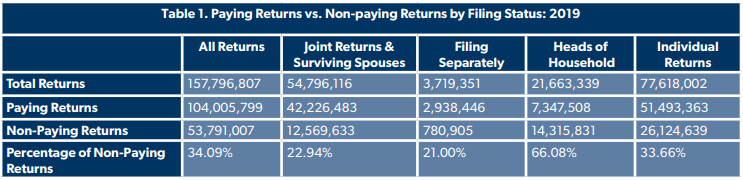
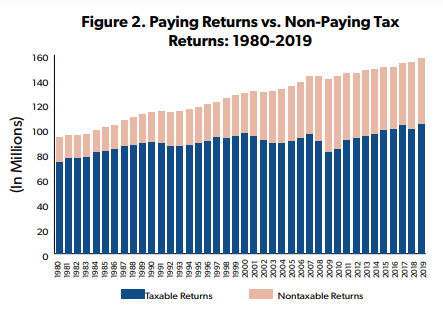
When considering the design of the federal income tax system, it is important to note that a significant number of returns have no income tax liability at all. The latest data released from the IRS shows that over a third of returns in tax year 2019 (34.1 percent of all returns) owed no income tax.[1]
The number of nontaxable returns is, in part, related to economic fluctuations. During recessions, the number of filers owing no taxes will grow as unemployment increases and wages tend to decline. For example, over 40 percent of returns in 2009 and 2010 were nontaxable as America dealt with the lingering effects of the Great Recession beginning in 2008. The gains in employment in 2019 saw a modest increase in the number of taxable returns. Data also shows that earnings for middle income earners increased.[2]
The number of filers owing no income taxes is also a result of the increasing progressivity of the tax system. NTUF’s annual Who Pays Income Taxes study finds that the wealthiest Americans pay an outsized portion of all income taxes.[3] In 2019, the top 25 percent of earners paid 87 percent of income taxes while the bottom 50 percent of income earners paid three percent of all income taxes, compared to their Adjusted Gross Income (AGI) share of 11.5 percent.
Historical data that NTUF has tracked since 1980 show that even as the top marginal tax rates have been significantly reduced, the tax code has tended to grow more progressive as other changes were made to shield low-income earners from income taxes. For example, the lowest income bracket for a married couple filing jointly for tax year 1980 imposed a 14 percent tax on income of at least $3,400 ($11,230 in 2019 dollars).[4] Since 2002 a tax rate of 10 percent has been applied to the lowest tax bracket. For 2019, this applied to income up to $19,400.
Many filers are shielded from this by the standard deduction, a flat amount that taxpayers can automatically deduct from taxable income if they choose not to itemize. The standard deduction was also increased from $3,400 in 1980 to $12,700 in 2017 for married filers, significantly reducing taxable income and simplifying returns.[5] Similarly, the standard deduction for single filers expanded from $2,300 to $6,350.
The TCJA lowered many tax rates and also nearly doubled the standard deduction from $6,350 for single taxpayers and married individuals filing separately to $12,000, and from $12,700 to $24,000 for married couples filing jointly. As Table 2 below shows, this is a large benefit to taxpayers.
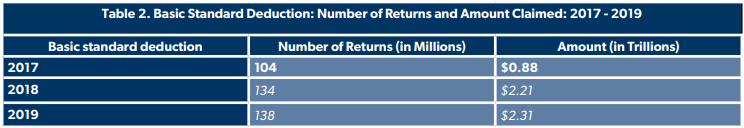
The number of filers claiming the basic standard deduction increased by 29 percent from 2017 to 2018, the first year of the TCJA. By comparison, the total number of filers increased by one percent from 152.9 million to 153.8 million those years. The total value of income covered by the standard deduction increased by over two and half times, from $876 billion to over $2.2 trillion.
As Table 1 shows, two-thirds of returns filed by a head of household were nontaxable. Taxpayers in this category pay more than half the cost of supporting their household and are eligible for a higher standard deduction ($18,350 in 2019) and lower rates than single filers or those who are married and file separately.
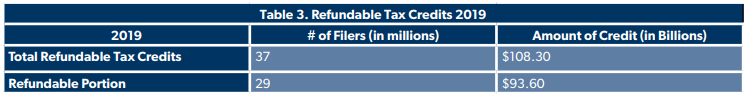
After filers calculate their Adjusted Gross Income (AGI), they may be eligible for tax credits that further reduce their income tax liability. Some of these tax credits are refundable so that filers can claim them even if they owe no taxes, known as a refundable credit. In 2019, 37 million filers were eligible for refundable credits totaling $108 billion.
29 million filers received “refunds” above and beyond their tax liability amounting to $93.6 billion – 86 percent of all refundable credits. The refundable portion included $56 billion in payments for the Earned Income Tax Credit and $34 billion for the Additional Child Tax Credit, which was expanded by the TCJA.
These credits are geared towards low-income households such that 85 percent of the refundable portion went to filers with an AGI of $40,000 or less. Refundable credits can result in some filers recording a negative tax liability. IRS data shows that the average return for those with an AGI below $30,000 had a negative income tax liability.
However, saying a filer had no federal income tax liability is not the same thing as saying they had no federal tax liability whatsoever. Individuals with wage income are subject to payroll taxes to finance Social Security and Medicare, which is generally assessed at a flat rate from the first dollar of income. Some of the returns classified as not subject to a net income tax were also potentially subject to a host of additional taxes including self-employment taxes or “individual responsibility payments” for lack of health insurance coverage, among others.[6] But a review of federal analyses that take these additional taxes into account finds that the tax code remains highly progressive.[7]
Conclusion
The latest IRS data show the number of filers with no income tax declined moderately in 2019 with the economic expansion, yet remained consistent with the broader trend seen before enactment of the TCJA of the federal tax code becoming more progressive and exempting more middle class Americans from income tax liabilities.
While comprehensive tax data for 2020 is not yet available, it is likely that the number of filers with no income taxes will substantially increase given the impacts of the pandemic, the economic shutdown, and the expansion of refundable credits and the “recovery rebates” payments enacted by Congress through the CARES Act and other legislative responses.
As Congress considers changes to the tax code, these facts should be kept in mind when assessing distributional effects of any new law.
[1] Internal Revenue Service. (2021). “SOI Tax Stats - Individual Income Tax Returns Publication 1304 (Complete Report): 2019.” Retrieved from https://www.irs.gov/statistics/soi-tax-stats-individual-income-tax-returns-publication-1304-complete-report.
[2] Brady, Demian. Who Pays Income Taxes: 2019. National Taxpayers Union Foundation. December 7, 2021. Retrieved from https://www.ntu.org/foundation/detail/who-pays-income-taxes-tax-year-2019.
[3] Ibid.
[4] Tax-Brackets.org. “Federal Income Tax Brackets (Tax Year 1980).” Retrieved from https://www.tax-brackets.org/federaltaxtable/1981.
[5] Tax Policy Center. (2019.) “Standard Deduction: 1970 to 2019.” Retrieved from https://www.taxpolicycenter.org/statistics/standard-deduction.
[6] Internal Revenue Service. (2020). Individual Income Tax Returns 2018. Retrieved from https://www.irs.gov/pub/irs-pdf/p1304.pdf#page=301.
[7] Muresianu, Alex. Yes, the U.S. Tax Code Is Progressive. Tax Foundation. September 17, 2021. Retrieved from https://taxfoundation.org/us-tax-system-progressive/.