
(pdf)
It is currently trendy for politicians to question the fairness of the U.S. tax system, particularly concerning the perception that the wealthy are not paying their “fair share” of income taxes. However, it is essential to recognize that the tax code is designed to be very progressive – as people ascend the income ladder, they pay a higher tax rate.
Several features within the tax system, such as the standard deduction, marginal brackets, and refundable credits, serve to alleviate income tax burdens for lower earners. The latest data from the Internal Revenue Service (IRS) shows that the bottom 50 percent of earners pay just 2 percent of all income taxes. One-third of tax forms filed in 2021 had no income tax liability, with over 93 percent coming from filers earning $50,000 or less.
Nontaxable Returns in 2021
The newly published IRS data reflects tax forms for Tax Year 2021 (filed in 2022). There is generally a three-year lag in reporting this information, given the time needed to process and analyze all the data. In 2021, the IRS received 160.8 million tax returns (see Table 1). Over a third of returns (35 percent) owed no income tax. Returns of married filers typically have a lower share of nontaxable returns. For example, of the 54 million returns filed jointly, 22 percent indicated no taxes owed.
Similarly, nearly 4 million forms were submitted by married couples filing separately, of which 22 percent owed no income taxes. However, the 81 million returns filed individually comprised the largest filing group, representing more than half of all returns. Over one-third (36 percent) of these filings were nontaxable.
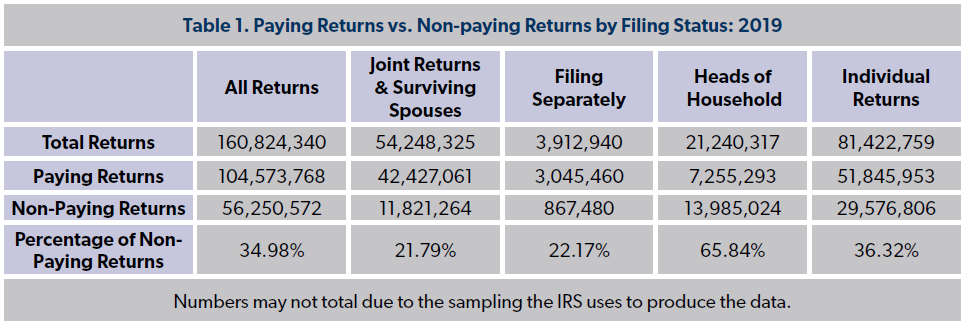
Two-thirds of the 21 million returns filed by a head of a household owed no income taxes. To file as head of household, a single individual must furnish over one-half of the costs of maintaining the household and have a qualifying child or dependent relative. The filing status allows for lower effective tax rates and a higher standard deduction than for single filers ($18,800 for heads of household and $12,550 for single filers in 2021). Returns from heads of household comprised 13 percent of all returns, 6 percent of all taxable returns, and 25 percent of all nontaxable returns in 2021. By comparison, joint returns comprised 34 percent of all returns, 40 percent of all paying returns, and 21 percent of non-paying returns.
Historical Comparison
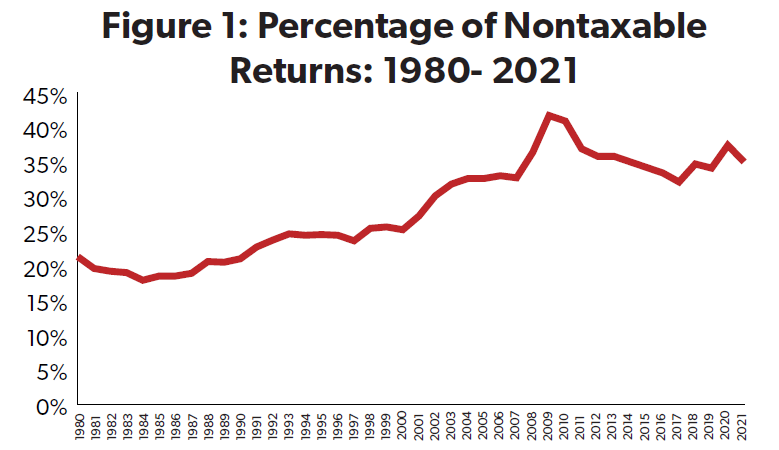
NTUF has collected IRS data on the levels of paying and non-paying tax returns back to 1980. The number of returns owing no income taxes receded from 2020’s rate of 37 percent, resulting from the pandemic-related economic contraction. The number of non-paying returns tends to increase during recessions and periods of high unemployment. Since data collection began in 1980, the highest level of non-paying returns was 41.7 percent in 2009, a result of the lingering effects of the Great Recession that began in 2008.
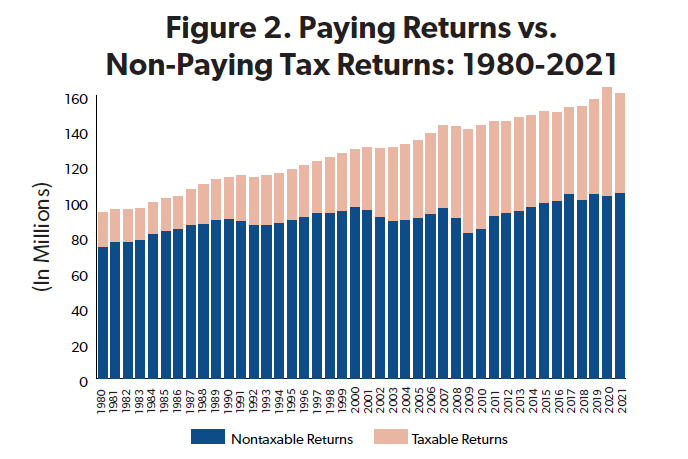
As depicted in Figure 2, the total number of returns filed in 2021 decreased compared to the previous year. From 2000 through 2019, the number of returns has shown an annual average increase of 1.1 percent each year. However, in 2020, returns saw a notable spike, with a 4 percent increase from 157.8 million in 2019 to 164.4 million.
The tax rebates enacted in 2020 played a role in the rise of returns. Starting in March 2020, the Coronavirus Aid, Relief, and Economic Security (CARES) Act provided Economic Impact Payments – otherwise known as “stimulus checks” – in the form of an advanceable refundable credit for 2020 of $1,200 per qualified adult and $500 per dependent. The payments were reduced for individuals with adjusted gross income (AGI) greater than $75,000 ($150,000 for married couples filing a joint return).To implement this provision, the IRS automatically provided the payments to those who filed in 2019 or 2018; otherwise, recipients would have had to file returns for that tax year by tax day in 2021 to receive the payment. As a result, many individuals with incomes less than the standard deduction amount (who are generally not required to file an income tax return) filed a tax return anyway for tax year 2020 to receive the CARES Act tax rebate.
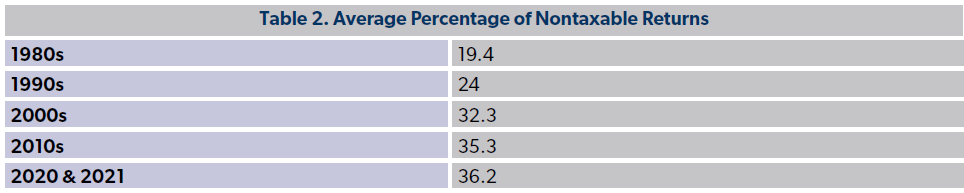
Over time, however, the general trend has been for the number of non-filers to increase. As Table 2 shows, the average percentage of nontaxable returns has steadily increased over the past few decades. The share recorded in 2020 and 2021 is close to twice as large as the average of the 1980s.
Even as major tax reforms since the 1980s reduced the top income tax rate from 70 percent to below 40 percent, the tax code has become more progressive. In 1980, one in five filers owed no income tax — compared to more than one in three today. NTUF’s annual Who Pays Income Taxes study of taxes paid since 1980 finds that higher-income earners have steadily paid a larger share of federal income taxes over time, while low-income earners have become increasingly shielded from significant income tax liabilities.
The Progressivity of the Income Tax Code
Taxpayers with low levels of income pay a lower tax rate today than they have in the past. The lowest income tax bracket for a married couple filing jointly for tax year 1980 owed a 14 percent tax on income above $3,400 ($10,762 in 2020 dollars). Since 2002, a tax rate of 10 percent has been applied to the lowest tax bracket. For 2021, this applied to income up to $19,900.
All taxpayers, especially lower-income taxpayers, can take advantage of the standard deduction to have a flat amount of income completely free from income tax. Many filers benefit from this standard deduction if they choose not to itemize. The standard deduction for a married couple increased from $3,400 in 1980 to $12,700 in 2017. The Tax Cuts and Jobs Act of 2017 lowered many tax rates and also nearly doubled the standard deduction; these reforms significantly reduced taxable income. With annual adjustments, in 2021, the standard deduction for married filing jointly was $25,100. For single taxpayers and married individuals filing separately, the standard deduction was $12,550, and for heads of households, the standard deduction was $18,800.
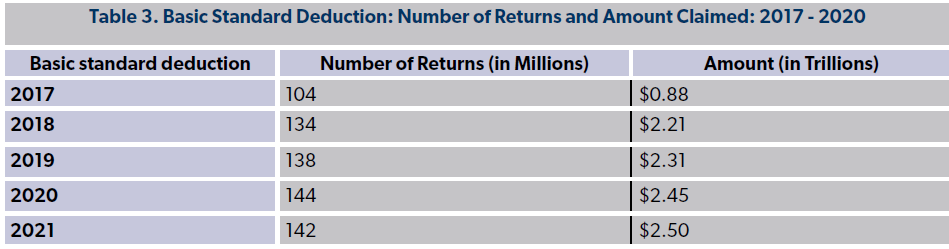
As Table 3 below shows, the expansion of the standard deduction (in the place of previous personal exemptions) starting in 2018 provided a substantial benefit to taxpayers.
The number of filers claiming the standard deduction increased from 68 percent of all returns in 2017 to 87 percent of all returns in 2018, the first year of the TCJA. The total value of income covered by the standard deduction increased by over two and half times, from $876 billion to over $2.2 trillion in 2017. In 2021, 142 million returns claimed the basic standard deduction for a total benefit of $2.5 trillion.
Non-refundable and refundable tax credits also further reduce income tax liability. After filers calculate their AGI, they may be eligible for tax credits such as the Earned Income Tax Credit (EITC), child tax credit (CTC), or others. Some of these tax credits are refundable, meaning that filers can claim them even if they owe no taxes.
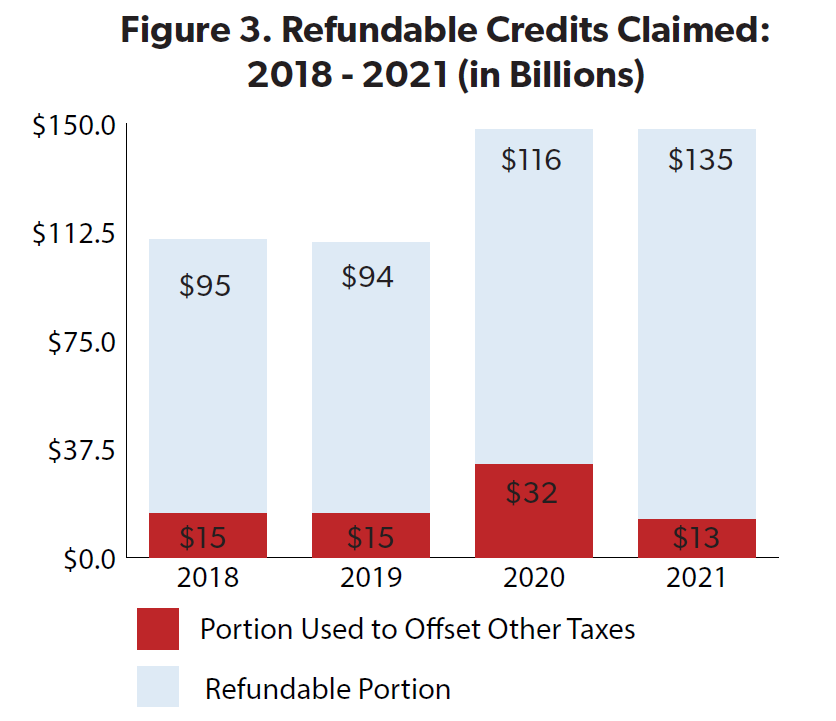
Figure 3 above shows the value of refundable credits claimed from 2018 through 2021. The figures for 2018 and 2019 are similar. Nearly 37 million filers claimed refundable credits in each of those years, totaling $110 billion and $109 billion, respectively. Of those amounts, $15 billion in refundable credits offset filers’ tax liability with the remainder paid out as the refundable portion. In both years, nearly 86 percent of these credits were refunded. This portion of the credit is recorded as outlays in the federal budget.
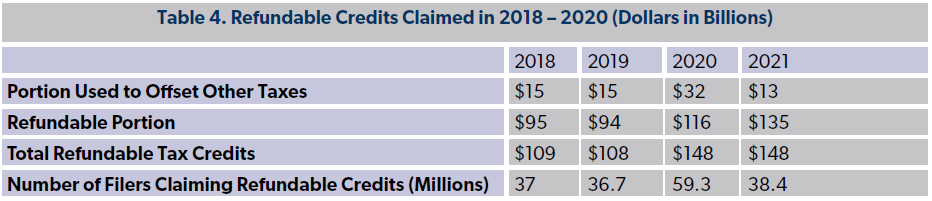
The number of refundable credits increased in 2020 and 2021, driven by a drop in income as a result of the economic recession and the expansion of refundable credits in the CARES Act and in the American Recovery Plan Act of 2021. 2020 saw a 60 percent increase in the number of filers eligible for refundable credits, and total refundable credits increased to $148 billion. There were fewer filers claiming refundable credits in 2021 but the overall value of those credits claimed remained the same.
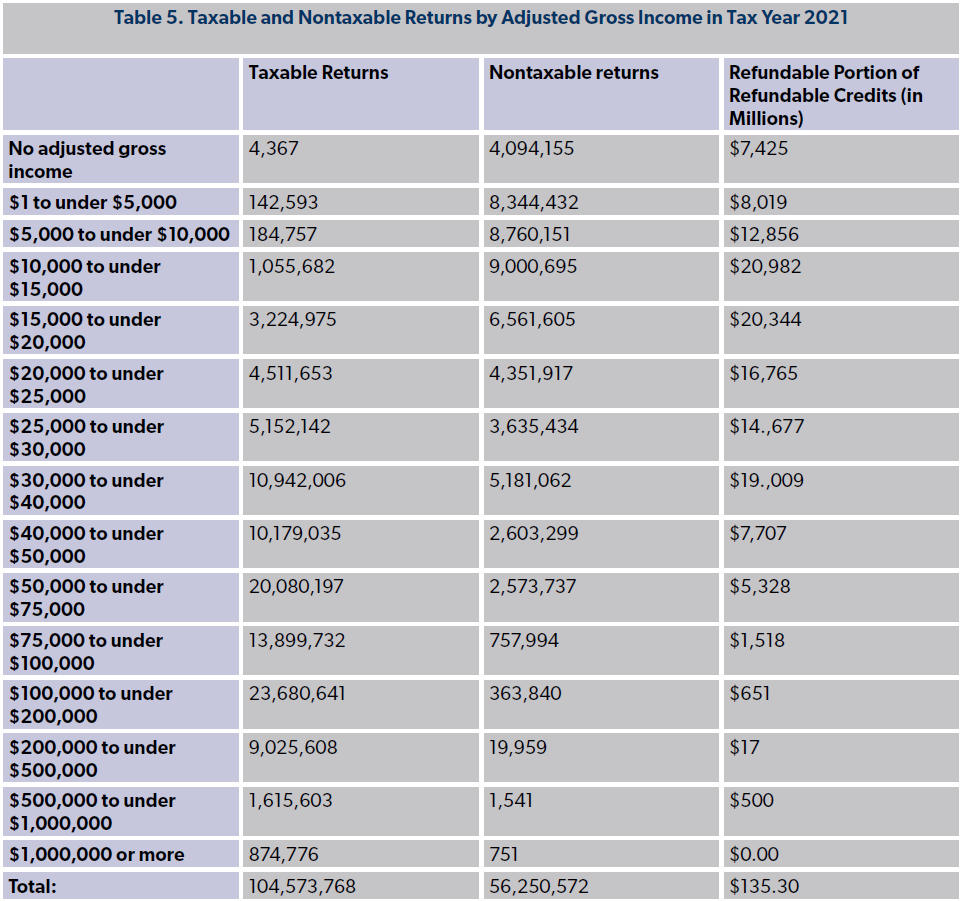
These credits primarily benefit lower-income individuals. Table 5 below shows the share of refundable credits by income in 2021. Nearly $128 billion, or 94 percent of the total refundable portion of these credits, were claimed by those with AGIs of $50,000 or less.
It is important to note that filers with no federal income tax liability do not necessarily have no federal tax liability whatsoever. Individuals with wage income are subject to payroll taxes to finance Social Security and Medicare, which is generally assessed at a flat rate from the first dollar of income. Some of the returns classified as not subject to a net income tax were also potentially subject to a host of additional taxes, including self-employment taxes. However, a review of federal analyses that takes these additional taxes into account finds that the tax code as a whole remains highly progressive.
Conclusion
Despite shifts in tax policy over the decades, including major reforms aimed at reducing top marginal income tax rates, the tax code has grown more progressive, with higher-income individuals shouldering a larger proportion of the income tax burden. Features, including the standard deduction, marginal brackets, and refundable credits, provide significant relief for lower-income earners.
Regardless of how politicians talk about fairness, it is important to remember how the U.S. tax system was designed to be highly progressive, and the data confirms that this is indeed the case.