
(pdf)
In the debate regarding the fairness of the income tax system, the fact that a significant number of returns have no income tax liability is often overlooked. The latest data released from the Internal Revenue Service (IRS) shows that nearly a third of returns in tax year 2017 paid no income tax. Moreover, the percentage of filers with no income liability has generally increased from where it was nearly 40 years ago. This trend is indicative of a progressive income tax code under which higher-income earners pay a larger of taxes while low-income earners are generally shielded from significant income tax liabilities.
NTUF’s latest “Who Pays Income Taxes” study for tax year 2017 finds that the wealthiest 1 percent of earners shoulder over 38 percent of all income taxes, an amount that is nearly double their adjusted gross income share. Historical data since 1980 shows that the income tax code has grown increasingly progressive, with a small share of earners paying an increasing share of the tax burden, even as the top marginal tax rate was reduced.
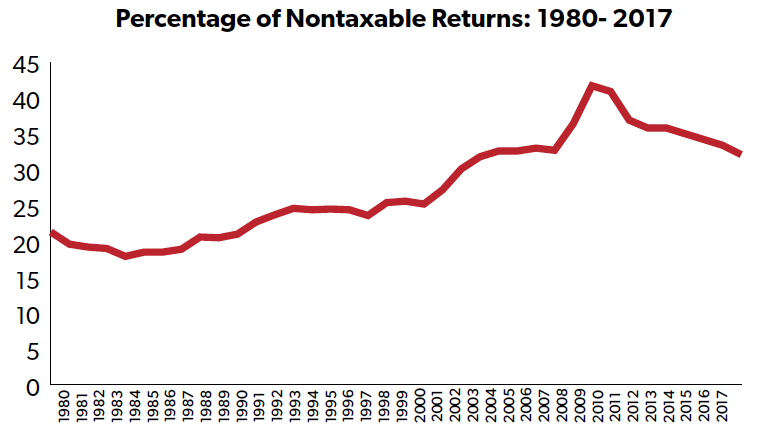
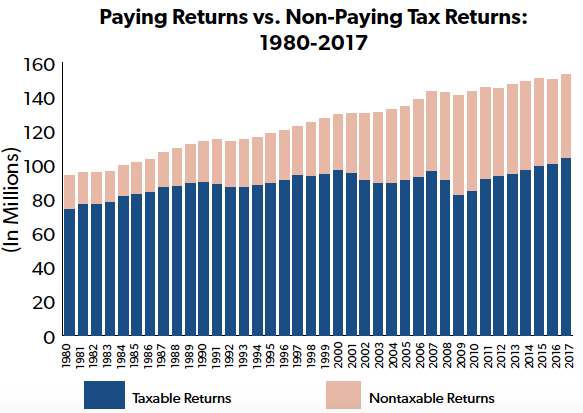
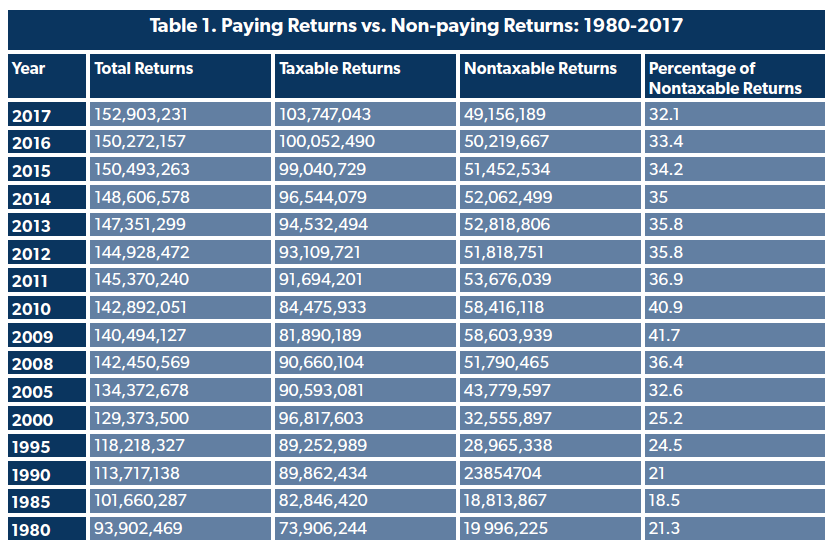
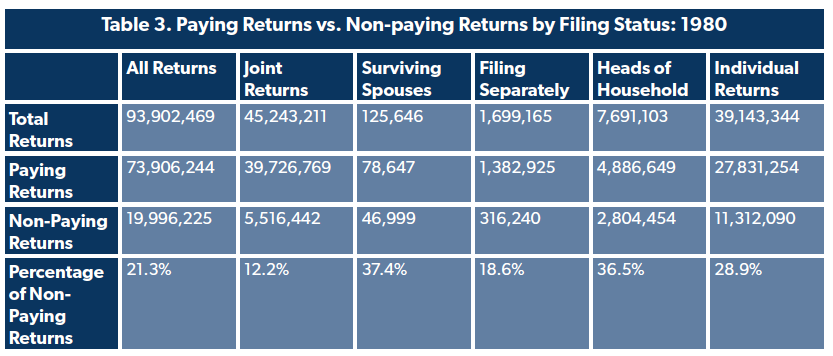
Correspondingly, the share of filers with zero income tax liability has trended up. In 1980, the percentage of returns with no income tax liability stood at 21.3 percent. By 1985, it dropped to 18.5 percent, but it has generally grown since.
Over time, policymakers have adjusted features of the income tax designed to shield low-income workers from significant burdens. For example, the lowest income bracket for a married couple filing jointly for tax year 1980 imposed a 14 percent tax on income of at least $3,400 ($9,634 in 2017 dollars). By 2017, the lowest bracket was adjusted to a 10 percent tax on income over $18,650. The standard deduction was also increased from $3,400 in 1980 ($9,634 in 2017 dollars) to $12,700 in 2017 for married filers, significantly reducing taxable income. (A similar expansion occurred for single filers.)
The number of nontaxable returns is also reflective of the number of exclusions, deductions, and credits available to eligible filers. The Congressional Budget Act of 1974 requires that the annual federal budget include a list of “tax expenditures” which are defined in law as “revenue losses attributable to provisions of the federal tax laws which allow a special exclusion, exemption, or deduction from gross income or which provide a special credit, a preferential rate of tax, or a deferral of tax liability.’’ The number of such tax provisions has grown. A historical budget book from 1981 lists 82 individual income tax expenditures for fiscal year (FY) 1980. A recent budget publication includes 142 different individual income tax expenditures that were claimed in FY 2017.
These exclusions also include “refundable credits” that eligible filers can receive above and beyond their income tax liability. These credits reduce a filer’s income tax liability, but unlike regular tax credits, any remaining credit amounts are “refunded” as a cash payment. The IRS reports that $100 billion in refundable credits were claimed in 2017. Fifteen percent of this amount was applied to reducing income tax burdens while the rest was essentially converted into subsidy checks, mostly from eligibility for the Earned Income Credit ($56.8 billion) and the Additional Child Tax Credit ($23.3 billion). Because of these credits, filers with an Adjusted Gross Income of $30,000 or less had an average tax rate that was actually negative.
In part, the number of nontaxable returns is indicative of the state of the economy. After the 2008 recession, 41.7 percent of returns – two out of every five – owed no income tax in 2009, due to a combination of higher levels of unemployment and tax relief (including refundable credits) in the American Recovery and Reinvestment Act of 2009. As the economy eventually recovered and employment grew, the number of taxable returns has gradually increased, yet still represents a smaller share of returns than in 1980.
This is not to say that these households faced no federal tax liability whatsoever. Individuals with wage income are subject to payroll taxes to finance Social Security and Medicare. Many of the returns classified as not subject to a net income tax were possibly subject to a host of additional taxes including “as excess advance premium tax credit repayment, self-employment tax, uncollected employee Social Security and Medicare tax on tips, tax from recomputing prior-year investment credit, penalty taxes on individual retirement accounts, Section 72 penalty taxes, household employment taxes, health care individual responsibility payment, Additional Medicare Taxes, or golden parachute payments.”
This is the last set of data before the Tax Cuts and Jobs Act of 2017. It has been estimated that the number of filers with no income taxes will increase as a result of changes to the code. Effective starting in tax year 2018, the tax reform law lowered tax rates, nearly doubled the standard deduction, and expanded and increased the refundable child tax credit.These facts about the income tax code should be remembered when politicians argue that the rich aren’t paying their “fair share.”
Conclusion
A responsible tax system eases the burden on those at the bottom striving to work their way up. The latest IRS data shows that nearly a third of filers, primarily low-income earners, had no tax liability, with some facing a negative tax rate. The high number of nontaxable returns is yet another indication that America’s income tax code is highly progressive, with lower-income filers largely escaping heavy taxation.