
When lawmakers in Congress return to Washington, D.C. after the midterm elections, they will almost certainly try to pass an omnibus 2023 spending bill negotiated by Congressional leadership and senior appropriators. That bill is very likely to increase both defense and nondefense discretionary spending, and according to our projections even a one-time boost this year could also have substantial and negative spillover effects that increase federal debt by $700 billion over the next decade.
The top Senators on the Appropriations Committee, Chair Patrick Leahy (D-VT) and Ranking Member Richard Shelby (R-AL), are both retiring at the end of the year and are likely motivated to hash out a deal to cover spending for the rest of fiscal year (FY) 2023. The government is currently operating on a continuing resolution through December 16, since Congress could not agree to a spending package before the October 1 start of FY 2023. As with past bipartisan spending deals hashed out by appropriators and leaders of Congress, any year-end deal is likely to significantly increase defense spending (typically favored by Republicans) and nondefense spending (typically favored by Democrats). Both parties will claim wins, while taxpayers will likely be the biggest losers.
Currently, the nonpartisan Congressional Budget Office (CBO) projects that defense discretionary budget authority (BA) will increase 4.03 percent from FY 2022 to FY 2023, while nondefense discretionary BA will increase 4.56 percent over the same period.
However, an eight percent increase to both defense and nondefense discretionary BA is a more accurate projection at this point, for several reasons:
- A bipartisan majority on the Senate Armed Services Committee has already agreed to increase FY 2023 defense authorization levels to $845 billion, a roughly eight-percent increase from FY 2022;
- Democrats in the House have approved six FY 2023 appropriations bills so far (of the 12 normally considered each year), and have increased discretionary BA across those six bills by $49 billion, or 14 percent from FY 2022;
- Over the course of FY 2022 (October 2021 through September 2022), inflation as measured by CPI-U was around eight percent; and
- In recent bipartisan negotiations over spending bills, lawmakers have aimed for “parity” between defense increases and nondefense increases – as was the case just last year.
Even one-time increases to discretionary spending have negative ripple effects for many years, given these increases raise the baseline for future spending decisions by both parties in Congress. Increases in spending relative to CBO’s baseline also increase the cost of servicing the federal government’s debt – a particular concern at a time of high inflation and high interest rates.
NTUF has calculated three alternative scenarios for discretionary spending, and their impacts on spending, deficits, and debt:
Scenario | 2023 Discretionary Spending Increase | 2024-2032 Discretionary Spending Increases | Net Deficit Impact 2023-32 (including Debt Service Costs) |
Scenario #1 | 8% boost to defense and non-defense budget authority | Between 2.15% and 2.95% per year (CBO’s baseline) | $742 billion |
Scenario #2 | 8% boost to defense and non-defense budget authority | 3% per year | $1.138 trillion |
Scenario #3 | 8% boost to defense and non-defense budget authority | Between 4.30% and 5.90% per year (double CBO’s baseline) | $3.348 trillion |
Under Scenario #1, spending and deficits (including increased debt service costs) is $742 billion higher than CBO’s current baseline. Under Scenario #2, spending and deficits are $1.138 trillion higher than CBO’s baseline. Under Scenario #3, spending and deficits are $3.348 trillion higher than CBO’s baseline.
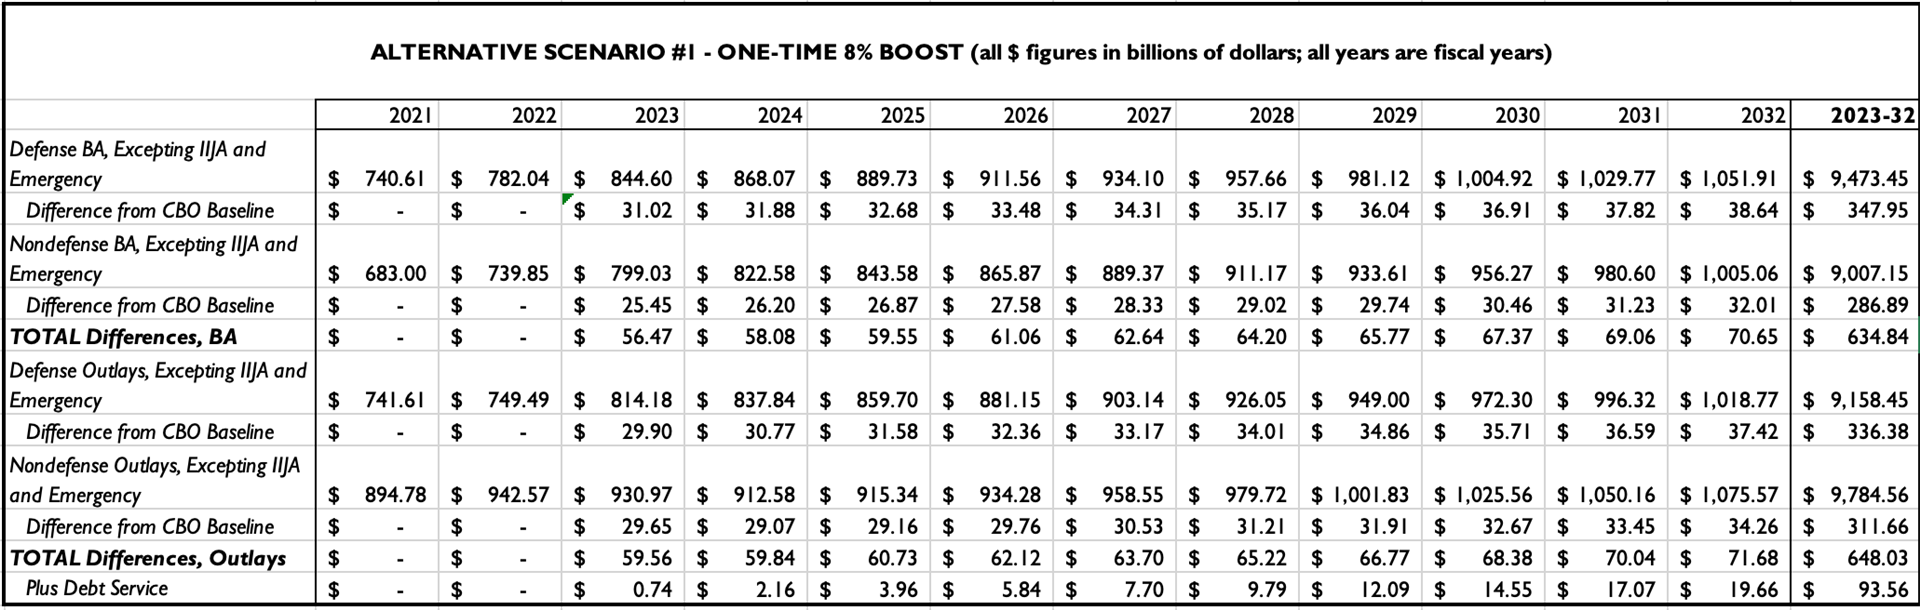
Scenario #1 - One-TIme 8% Boost
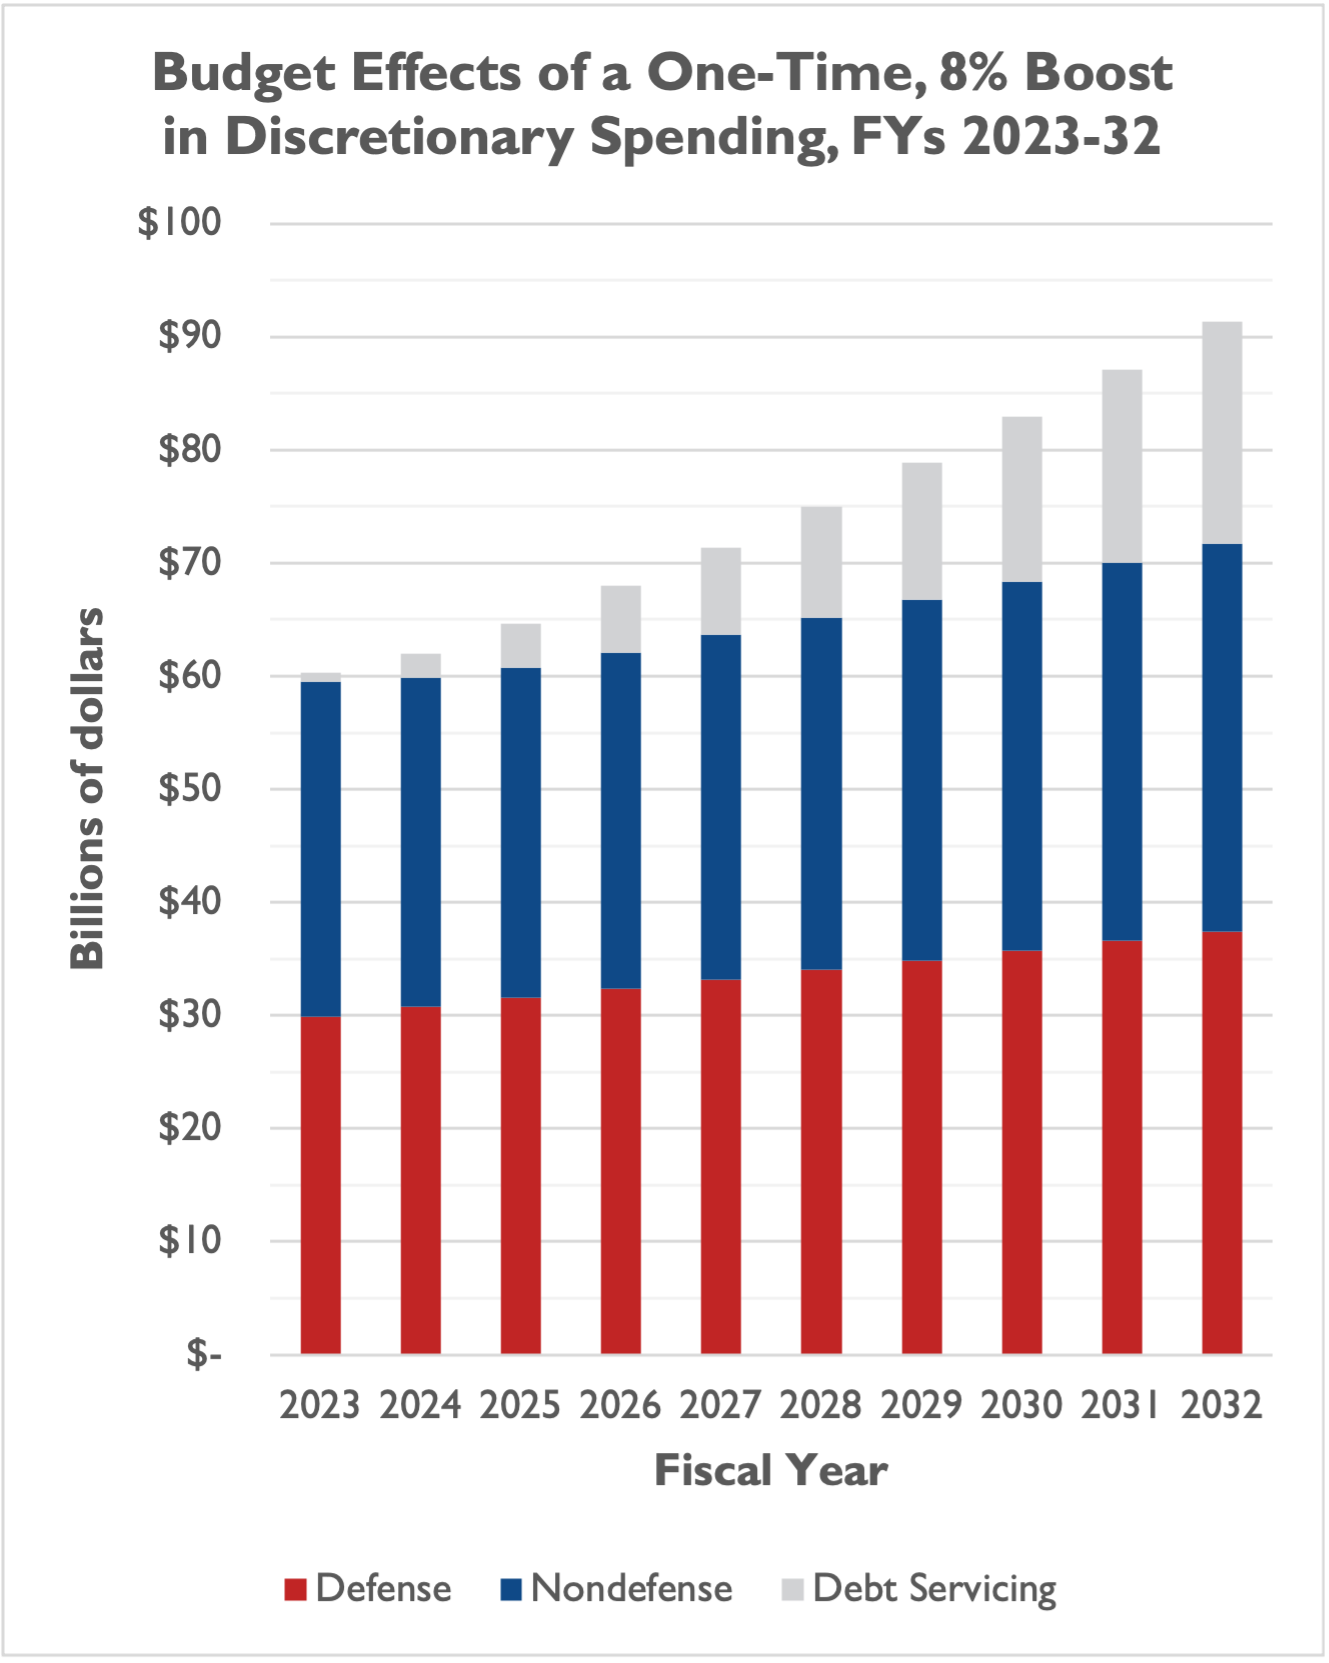
Under a one-time eight-percent boost, defense BA is $844.6 billion in FY 2023 ($31 billion higher than CBO’s current baseline of $813.6 billion). Nondefense BA is $799 billion ($25.5 billion higher than CBO’s current baseline of $773.5 billion).
Spending (as measured by BA) then grows at rates identical to CBO projections from FYs 2024 through 2032, but at a new, higher baseline due to the one-time boost for FY 2023.
We then project outlays, a different measure of spending that differs slightly from BA due to prior-year authorized spending and multi-year spending authority for some agencies and programs. We use the same proportion of outlays to BA as CBO, which generally projects that defense outlays will run at around 97 percent of BA over the 10-year window while nondefense outlays will generally run around 107 percent to 109 percent of BA (FYs 2023 and 2024 are exceptions). NTUF believes that an accurate assessment of the fiscal impact of legislation should include any increase in debt service costs.
Total discretionary outlays (defense plus nondefense) are $648 billion higher over 10 years than CBO’s current baseline. Higher interest spending from increased deficits and debt adds another $93.5 billion to spending over 10 years (we used CBO’s interactive worksheet to estimate debt service spending), yielding a total deficit impact of $741.6 billion over a decade. Just one year of major spending increases can have a significant impact on baselines for years to come.
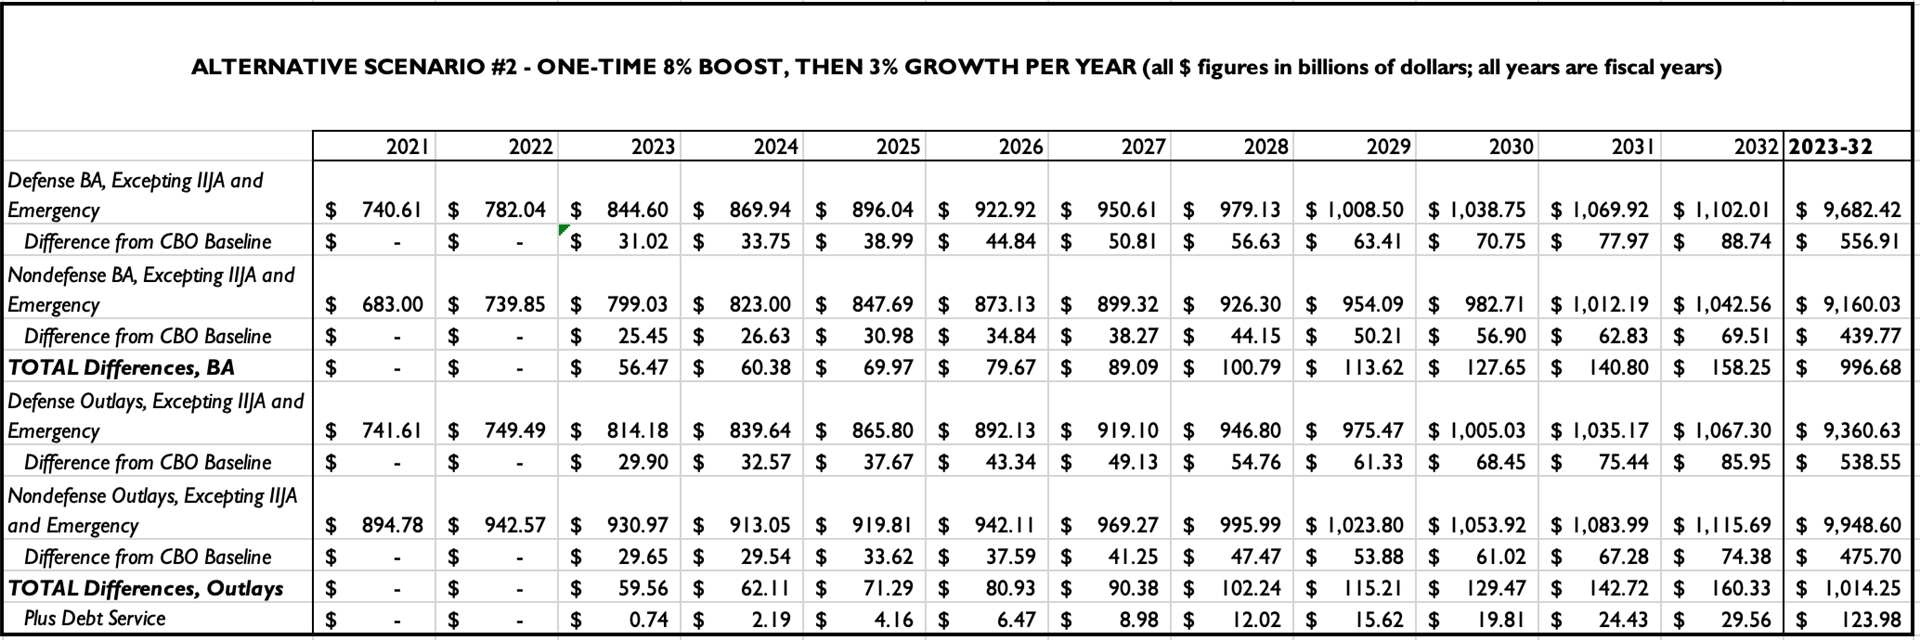
Scenario #2 - One-Time 8% Boost, Then 3% Growth Per Year
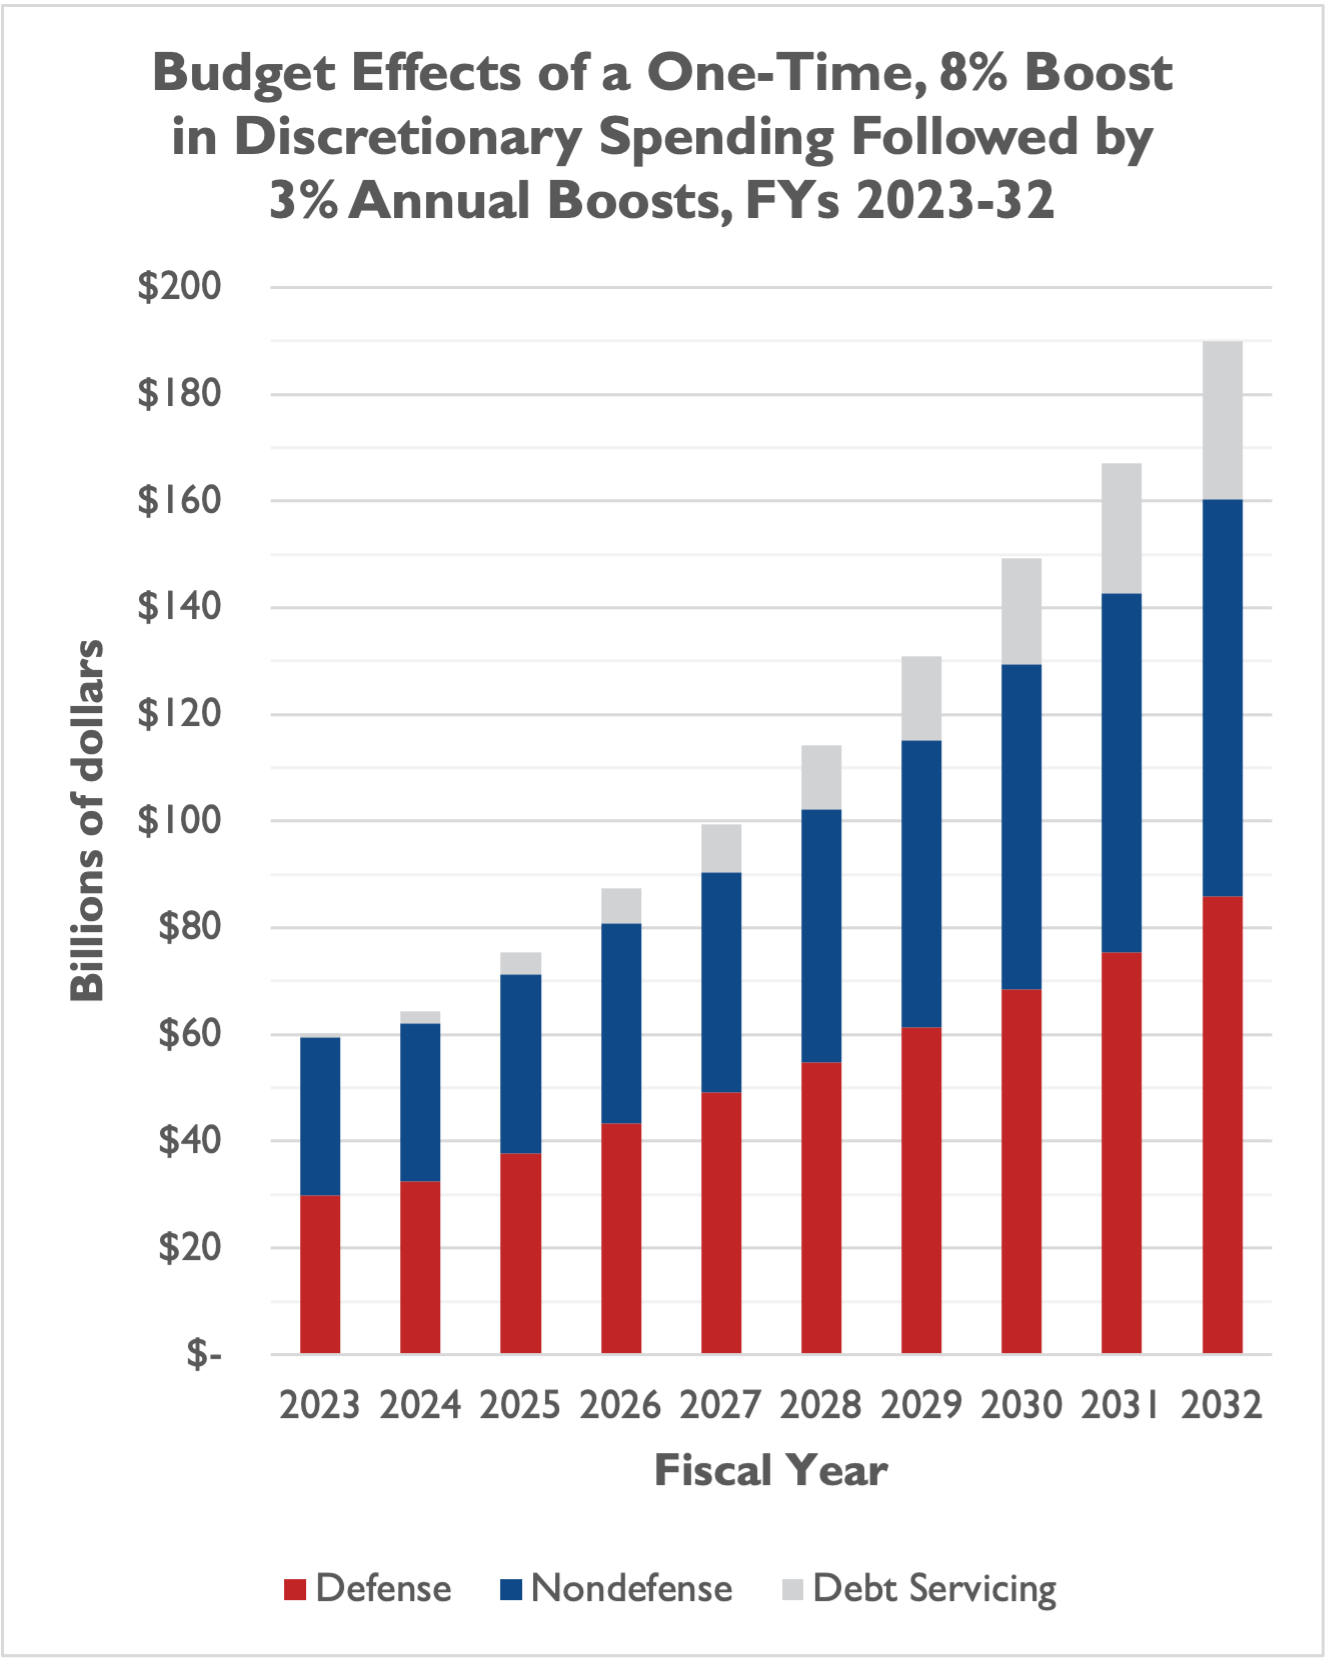
In our second alternative scenario, we hold the eight-percent boost in FY 2023 constant but then account for higher spending increases per year than under CBO’s current baseline.
CBO projects defense and nondefense BA to increase from anywhere between 2.15 percent and 2.95 percent per year from FYs 2024 through 2032. A three-percent per year scenario may be a more realistic alternative assumption, given recent annual increases in defense and nondefense outlays:
- FY 2018: 5.51 percent defense increase; 4.73 percent nondefense increase;
- FY 2019: 8.62 percent defense increase; 3.50 percent nondefense increase;
- FY 2020: 5.54 percent defense increase; 38.21 percent nondefense increase (this anomalous figure is due in significant part to COVID spending);
- FY 2021: 3.89 percent defense increase; -2.10 percent nondefense increase (again, an anomalous figure due to COVID spending); and
- FY 2022: 1.06 percent defense increase; 5.34 percent nondefense increase.
Under such a scenario, total discretionary outlays (defense plus nondefense) are $1.014 trillion higher over 10 years than CBO’s current baseline. Higher interest spending from increased deficits and debt adds another $124 billion to spending over 10 years, yielding a total deficit impact of $1.138 trillion over a decade.
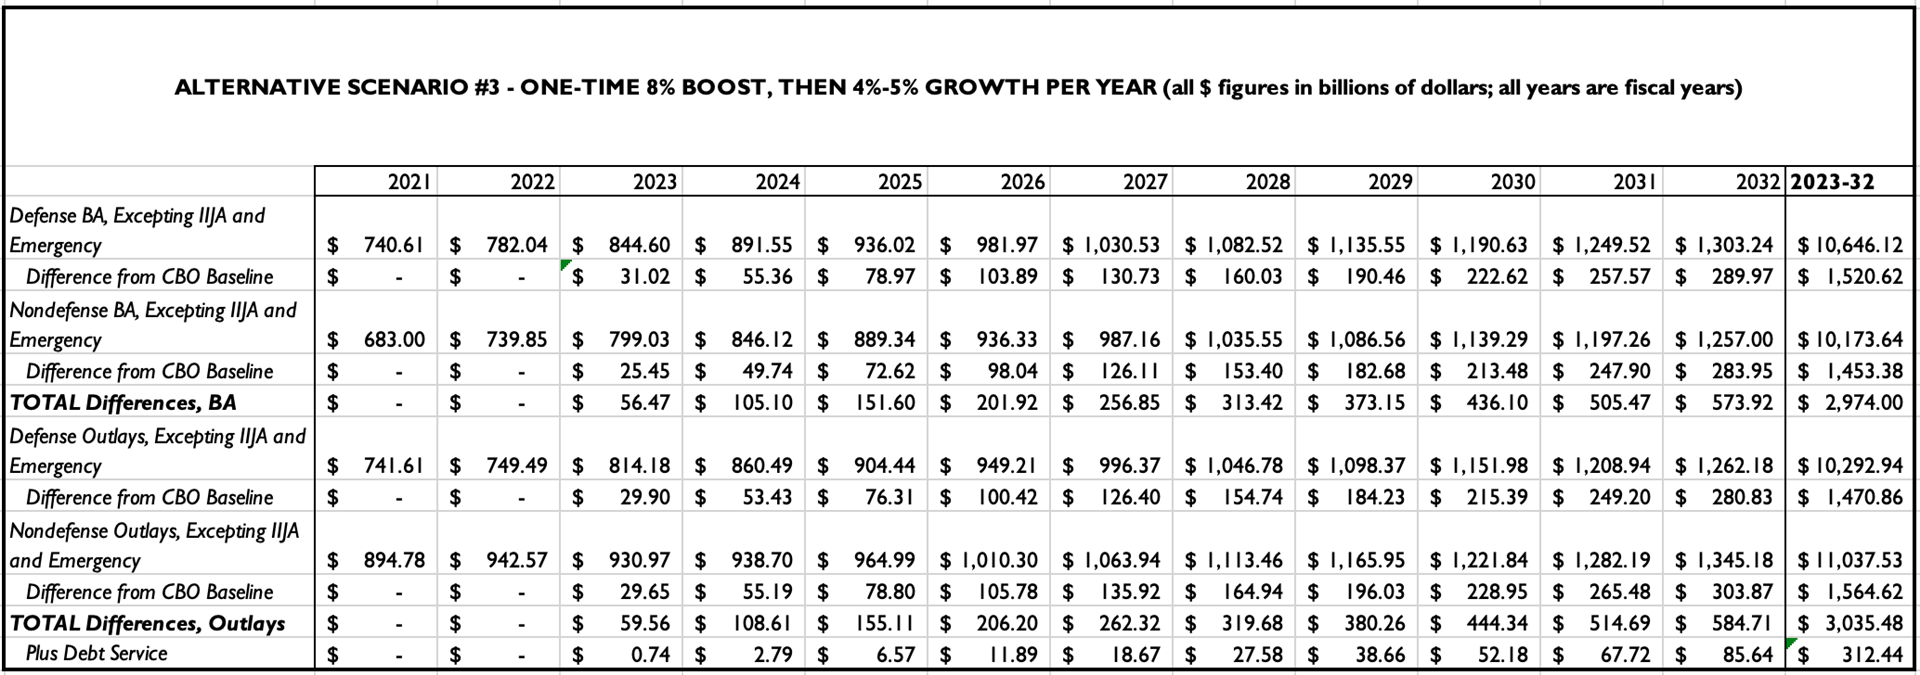
Scenario #3 - One-Time 8% Boost, Then 4-6% Growth Per Year
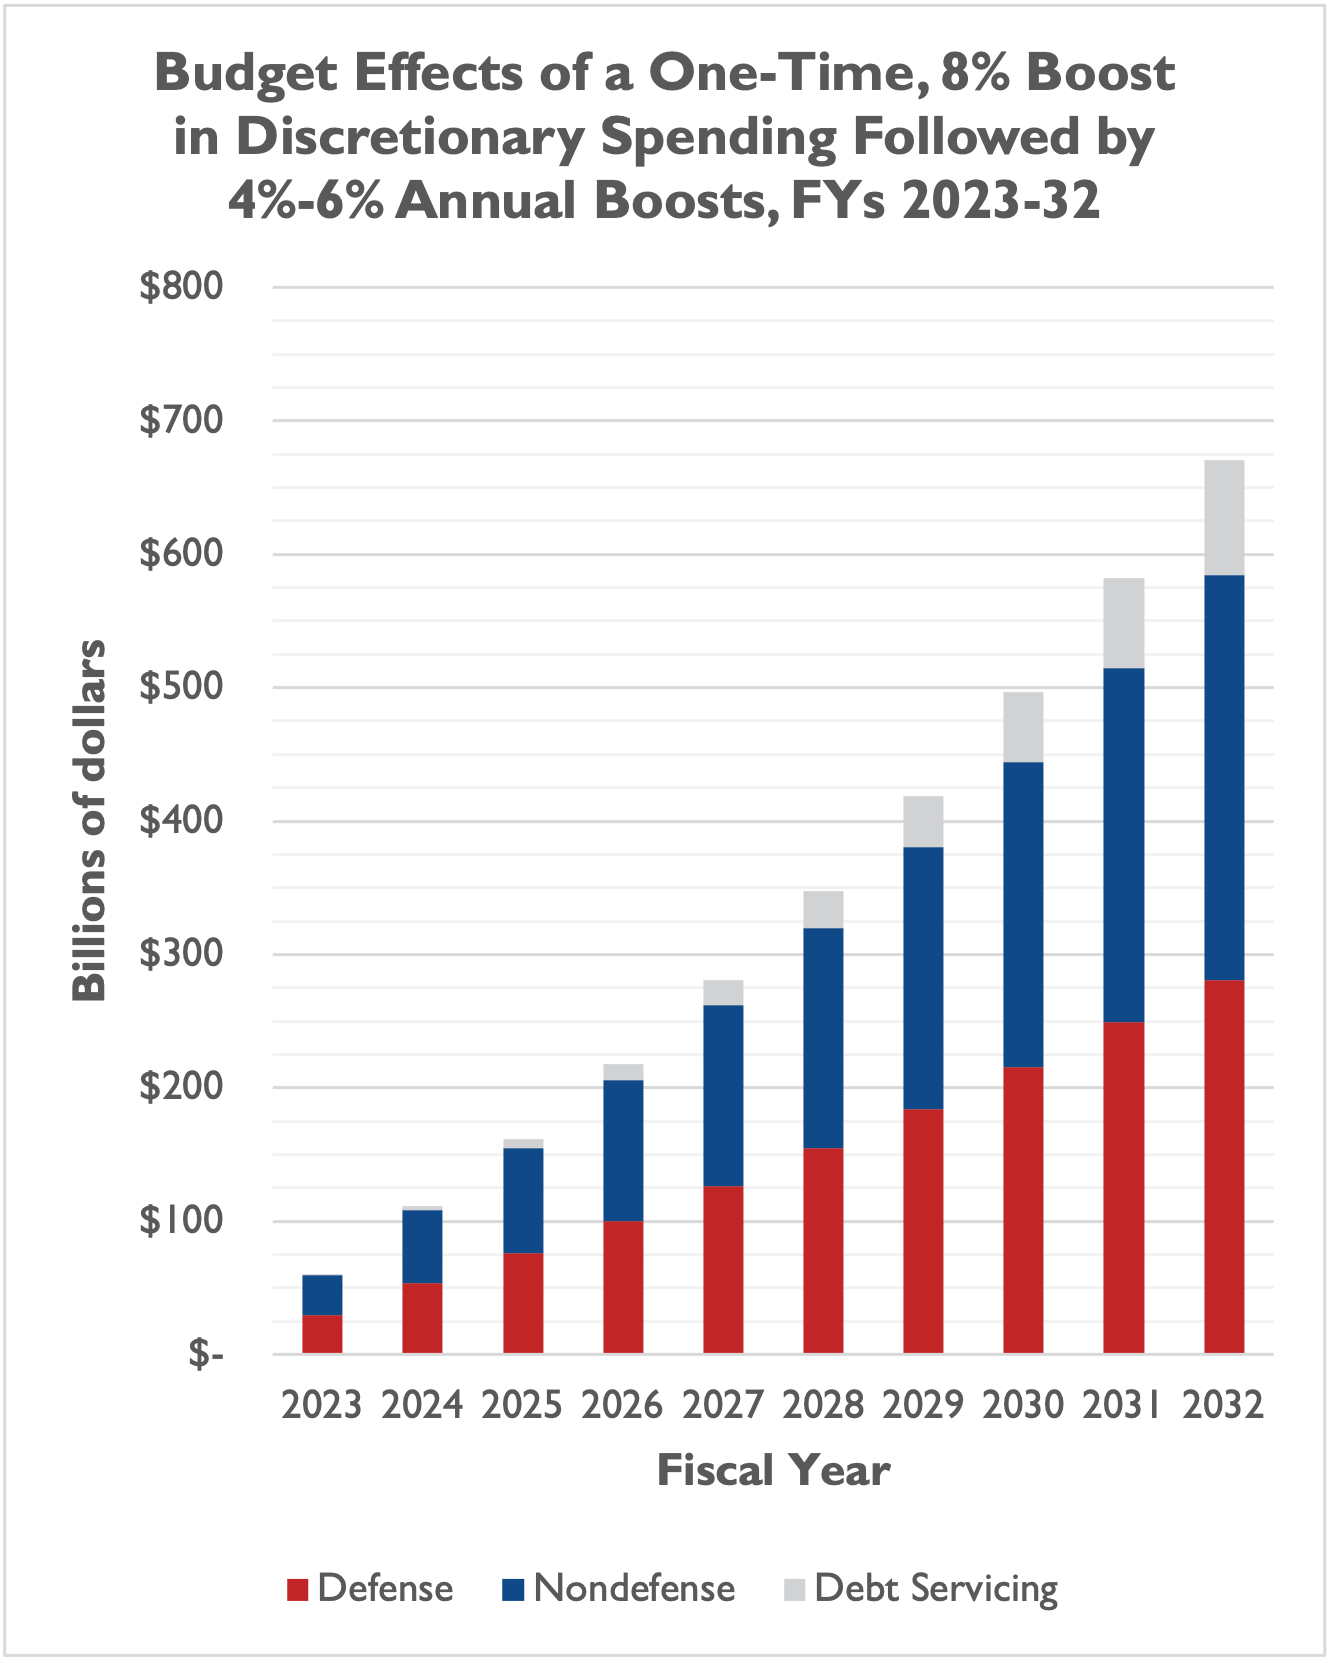
A final and more extreme alternative scenario involves Congress striking budget-busting ‘parity’ deals regularly over the ten-year window. Defense and nondefense BA grows at twice current CBO projected rates, all with the higher baseline established by the one-time eight-percent boost in FY 2023.
Under this scenario, total discretionary outlays (defense plus nondefense) are $3.035 trillion higher over 10 years than CBO’s current baseline. Higher interest spending from increased deficits and debt adds another $312 billion to spending over 10 years, yielding a total deficit impact of $3.348 trillion over a decade.
Deficits in Context
Any of the above scenarios would have a larger deficit impact than last year’s bipartisan infrastructure law, which CBO projected would add $256 billion to deficits over 10 years. Each scenario would also lead to higher deficits over a decade than the largest deficit-buster of the 117th Congress so far, the PACT Act ($276.6 billion).
Each scenario raises deficits more than President Biden’s student debt cancellation action, and increases deficits many multiples more than the just-enacted Inflation Reduction Act is supposed to cut deficits ($238 billion).
For the 333 million American citizens, deficits over 10 years are:
- $2,225 per person under Scenario #1;
- $3,415 per person under Scenario #2; and
- $10,047 per person under Scenario #3.
It Doesn’t Have to Be This Way
If Congress instead went on the most modest of discretionary spending diets – not even cutting spending, but just slowing discretionary spending growth over the decade – then lawmakers could actually reduce spending and deficits. Rep. Jodey Arrington (R-TX) has a proposal, the CAPS Act, to do just that. The CAPS Act would reduce spending and deficits by $500 billion in the next 10 years.
Such an effort would require political sacrifices from both Republicans (who typically love to increase defense spending) and Democrats (who typically push for huge boosts to nondefense spending). Even if one party gains unified control of Congress in future years, that party will need to act with restraint in order to keep the federal government on its discretionary spending diet.
Methodology
NTUF used CBO’s May 2022 baseline, the agency’s most recent baseline for spending, debt, and deficits over the next 10 fiscal years (FYs 2023 through 2032). We measured defense and nondefense discretionary budget authority (BA) and outlays, excluding CBO’s projected spending on the bipartisan infrastructure law and on emergencies.
We measured our alternative scenarios as increases to budget authority from year to year, rather than outlays. For projections of outlays, we mapped CBO’s projections of the ratio of outlays and budget authority onto our alternative scenarios. As noted above, outlays generally run beneath BA for defense (at a ratio of 96 percent to 97 percent, generally) and above BA for nondefense (at a ratio of 107 percent to 109 percent, generally). We used projected outlays in our alternative scenarios to estimate the increased costs of debt service, utilizing CBO’s interactive worksheet, “How Changes in Revenues and Outlays Would Affect Debt Service, Deficits, and Debt.”