
Key Facts
- Roughly 49 million filers (30.5%) owed no federal income tax in Tax Year 2023, marking the third consecutive year of decline following a pandemic-era peak.
- While the share of nontaxable returns fluctuates with economic conditions, the federal income tax system has become more progressive over time, as the share of non-paying filers has increased significantly from 21.3% in 1980 to 30.5%.
- This reflects policies designed to shield lower-income earners, including the TCJA’s larger standard deduction and the expanded use of targeted—and often more complex—refundable credits.
Introduction
Debates over tax fairness often miss a key reality: the federal income tax system is already highly progressive and has become more progressive even as lawmakers reduced the top marginal tax rates.
The latest data from the Internal Revenue Service (IRS) show that roughly one-third of filers now owe no federal income tax, up significantly from about one-fifth four decades ago, largely due to expanded deductions and credits that shield a growing share of income from taxation.
Nontaxable Returns in 2023
The IRS’s Statistics of Income (SOI) division publishes annual data on the distribution of income tax liability across filing statuses and income levels. The latest release, covering Tax Year 2023 (for returns filed in 2024), reflects the typical lag required to process and analyze complete filing data, including late and amended returns. While SOI normally releases this data in late fall or early winter, publication was delayed until the end of March 2026 by the extended government shutdown.
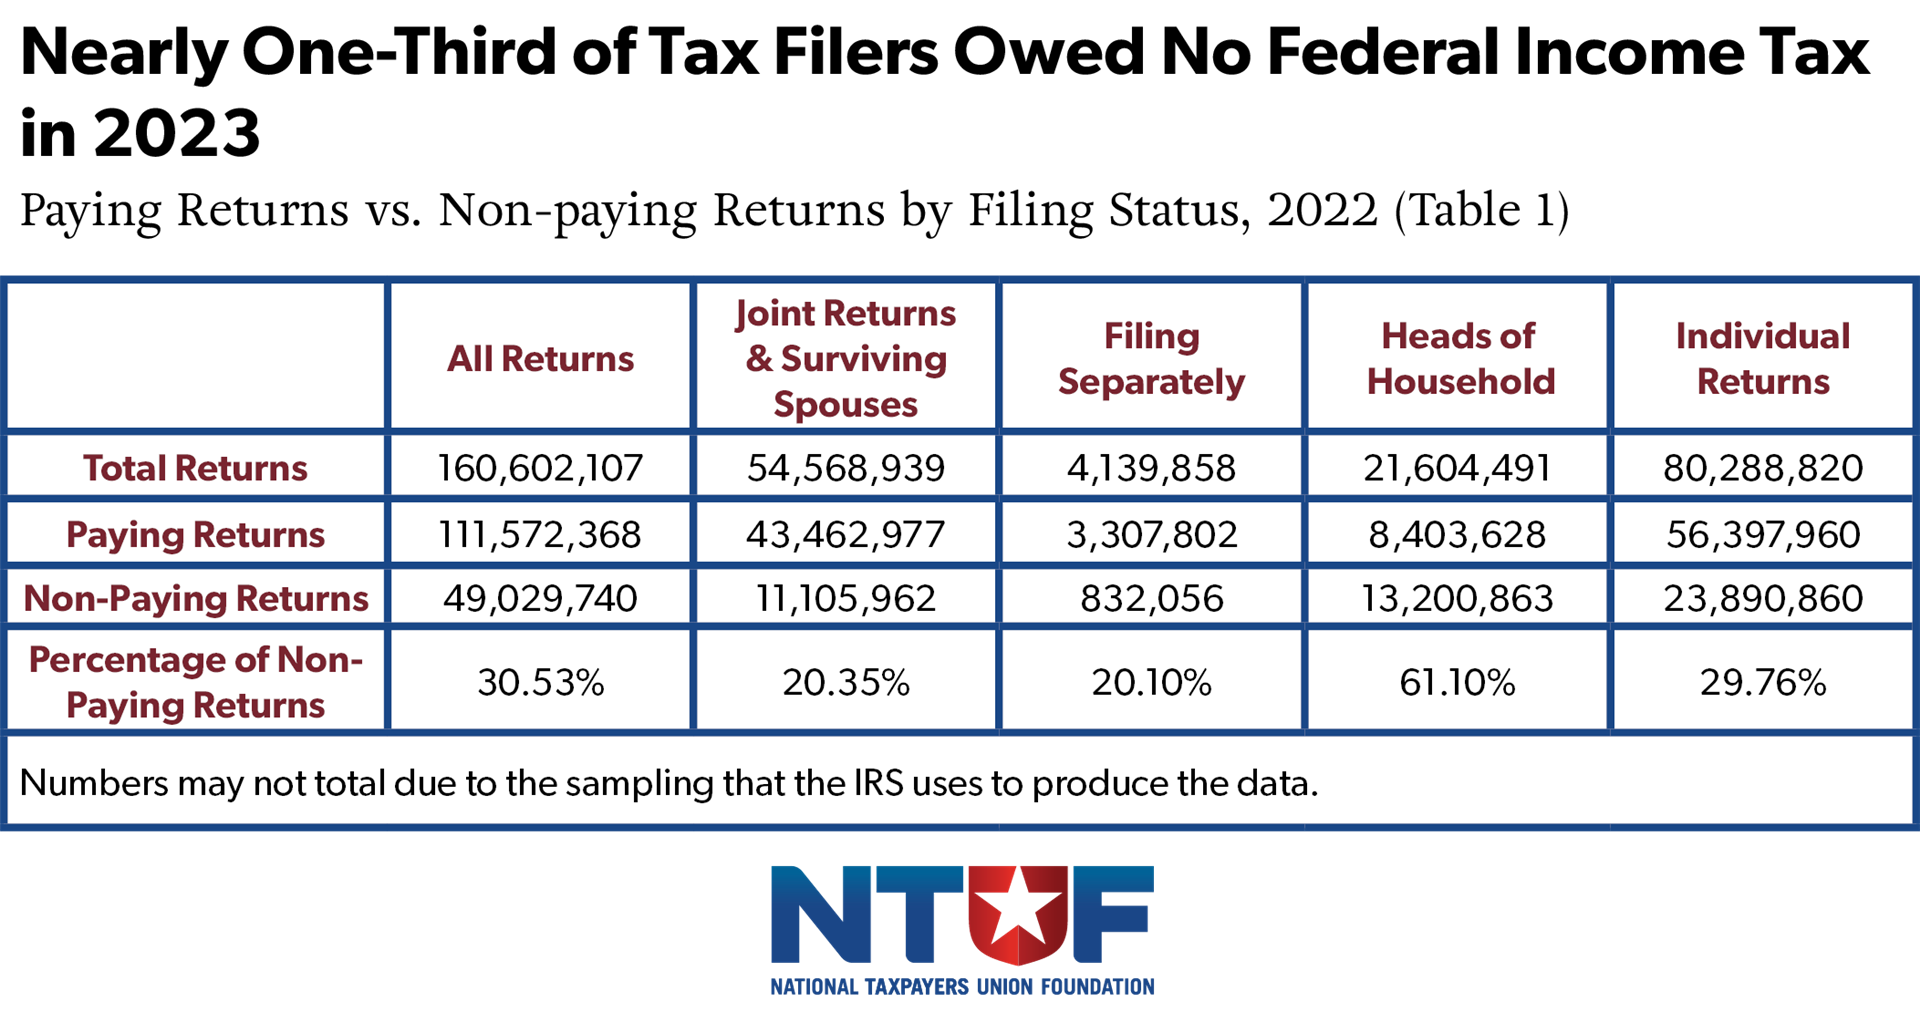
For Tax Year 2023, of the 160.6 million tax returns filed, just over 49 million returns (or 30.5%) were classified as non-paying. Non-paying returns include filers whose earnings fell below taxable thresholds or who qualified for credits or deductions that offset their liabilities.
Breakdown by Filing Status:
- Joint Returns and Surviving Spouses: Joint filers accounted for 54.6 million returns in 2023, with 11.1 million (20.35%) owing no income tax. Because this group typically has higher combined incomes, those in it are less likely to fall below taxable thresholds or fully offset liability through credits.
- Filing Separately: Of the 4.1 million returns filed under this status, 832,056 (20.1%) were non-paying. This category consistently shows a relatively low share of non-paying returns, in part because filers face tighter eligibility rules for certain deductions and credits.
- Heads of Household: Heads of household continue to have, by far, the highest share of non-paying returns. Of the 21.6 million returns filed, 61.1% owed no income tax. This reflects both the structure of the filing status—which provides a higher standard deduction and more favorable rate brackets—and the significant role of income-based credits such as the Earned Income Tax Credit (EITC) and Child Tax Credit (CTC).
- Individual Returns: Among the 80.3 million single filers, 29.76% had no income tax liability. This group includes a broad mix of taxpayers, including lower-income workers, part-time earners, and younger filers early in their careers.
Historical Trends in Nontaxable Returns
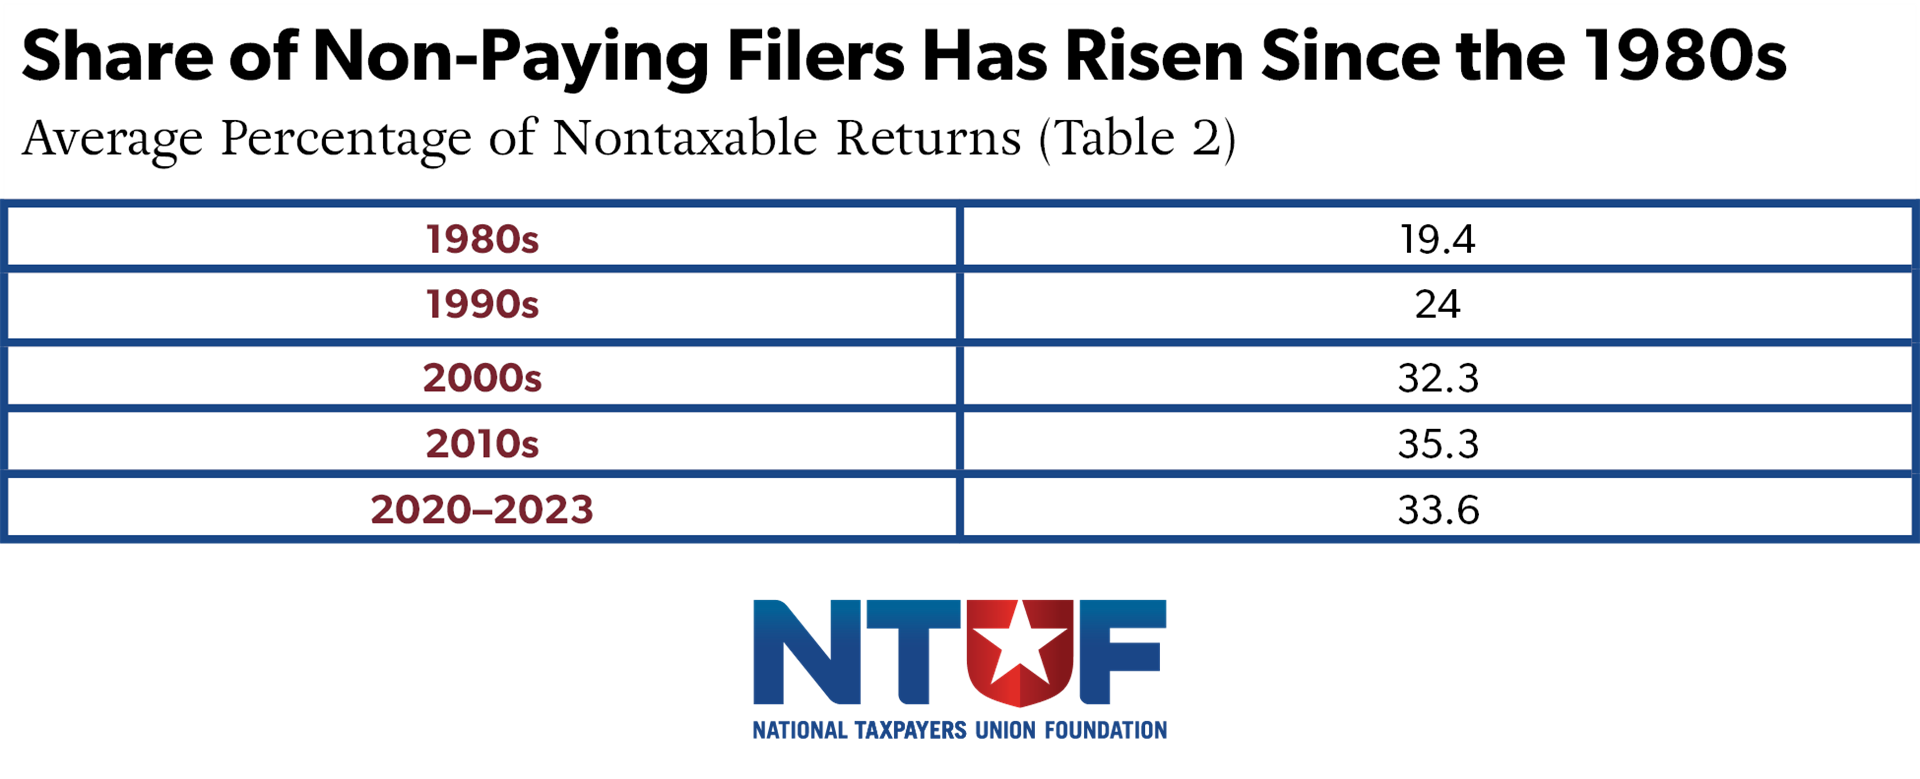
NTUF has collected IRS data on the levels of paying and non-paying tax returns since 1980. The share of nontaxable returns tends to fluctuate with economic conditions, rising during downturns as incomes fall and policymakers expand provisions that shield lower-income earners from liability. Over time, however, the broader trend reflects a structural shift in the tax code that has reduced or eliminated income tax liability for a growing portion of filers.
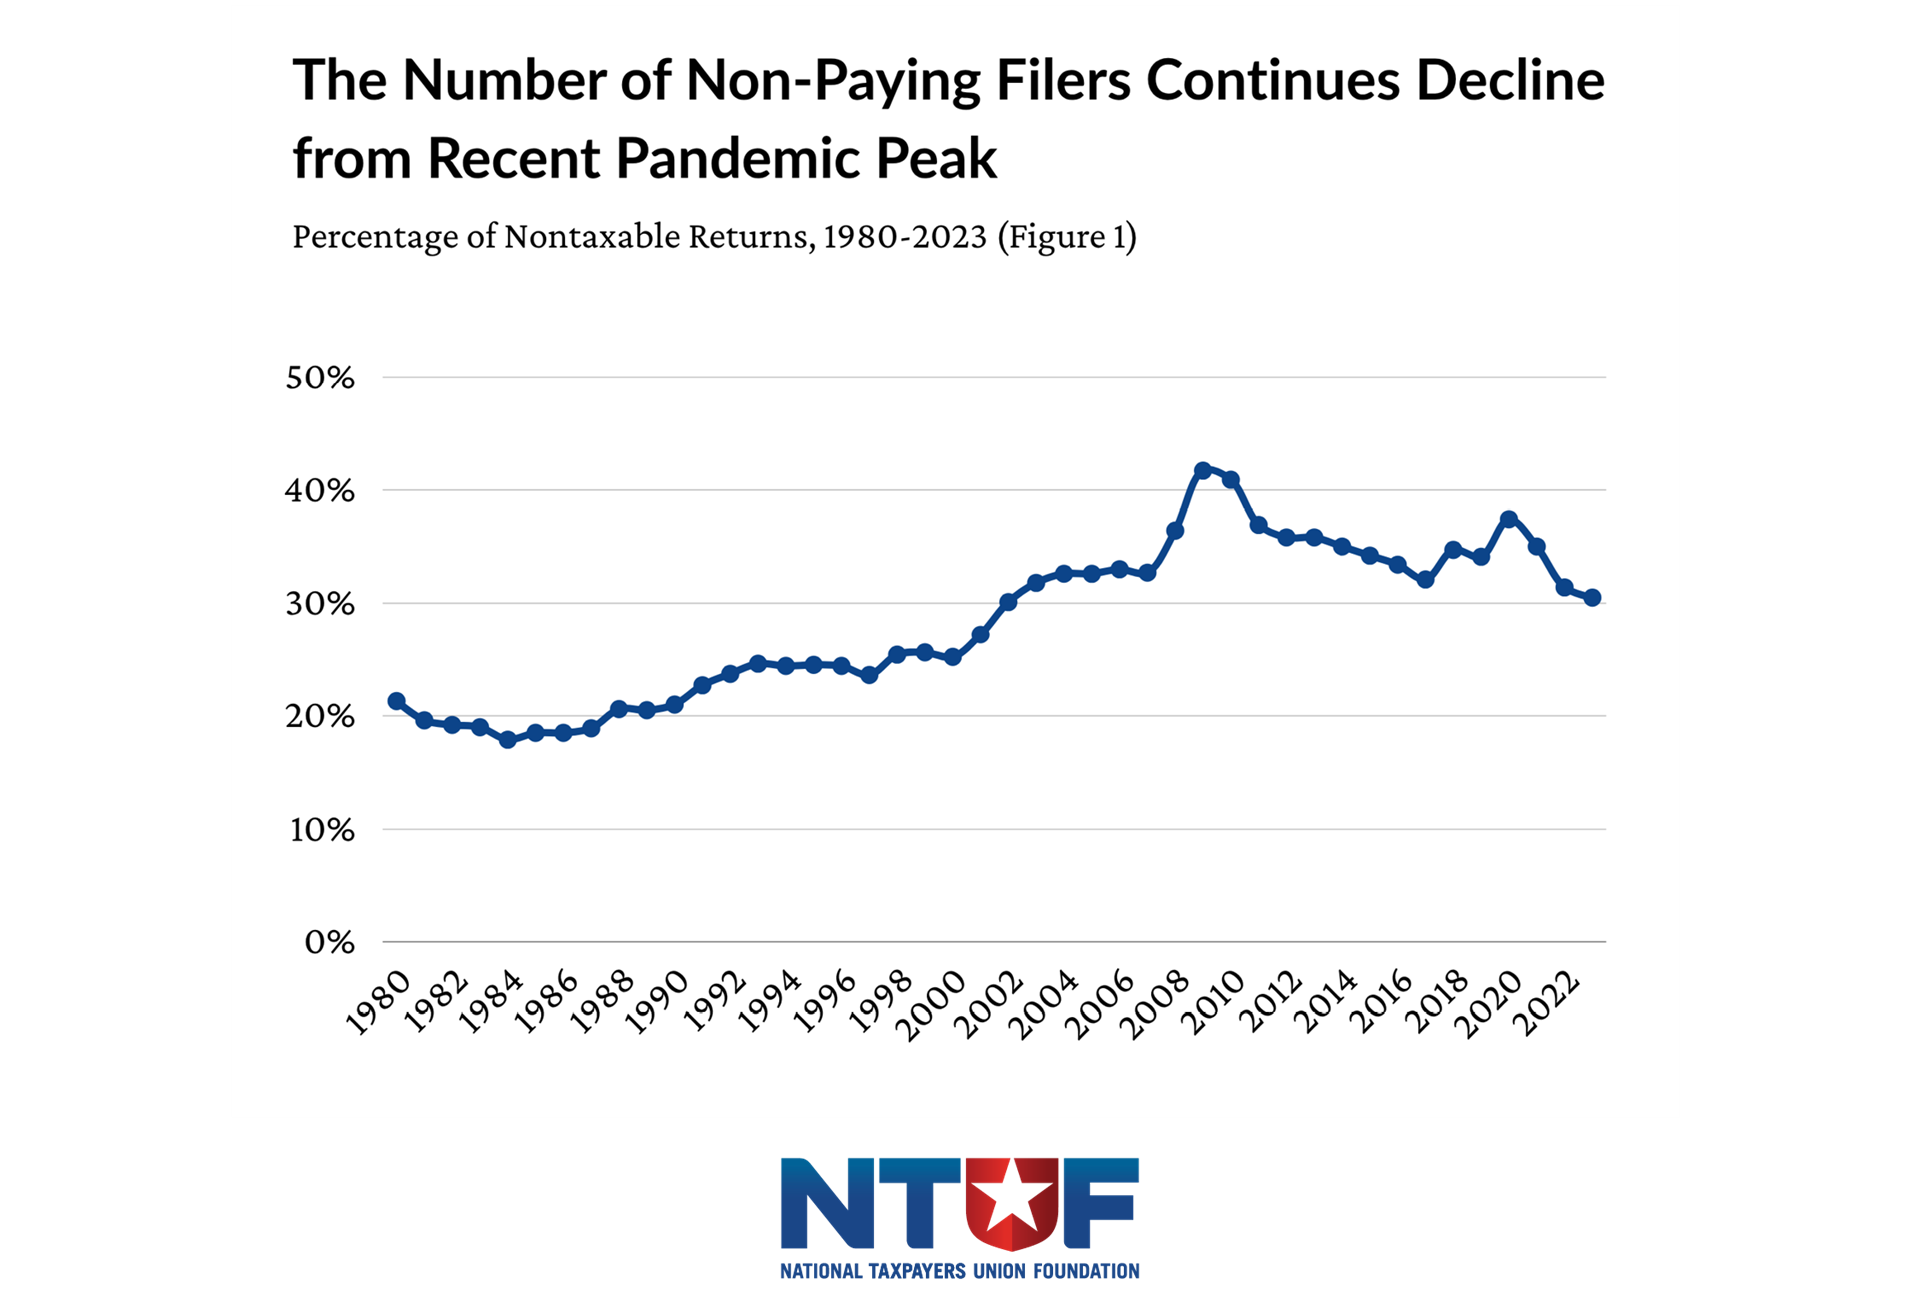
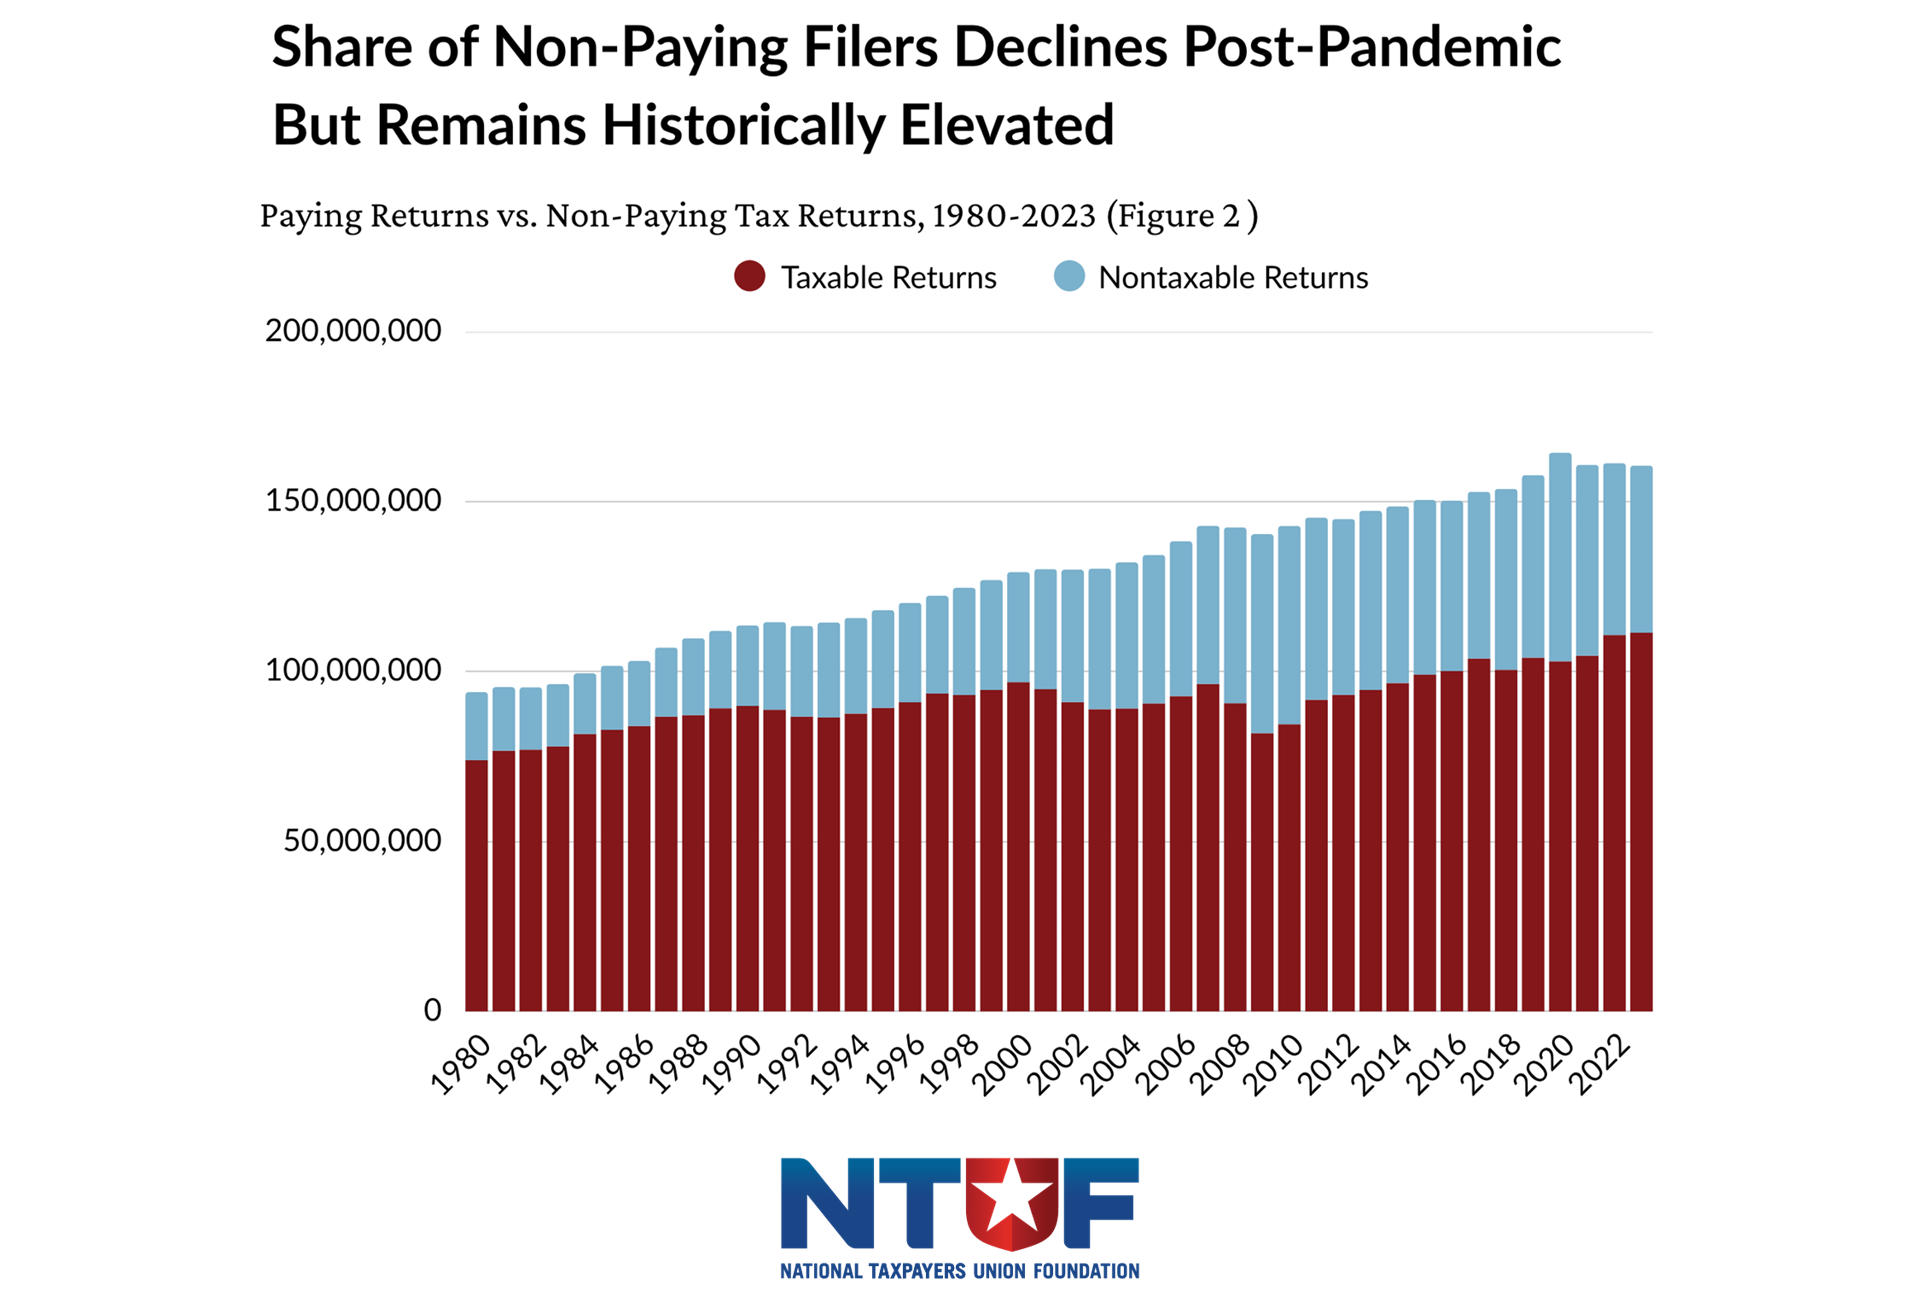
Over the past four decades, the share of tax filers owing no federal income tax has increased significantly, rising from 21.3% in 1980 to 30.5% in 2023—marking the third consecutive year of decline following a pandemic-era spike, and the lowest percentage since 2003.
The most notable spike occurred during the Great Recession, when the share reached a high-water mark of 41.7% in 2009 as incomes declined and tax relief measures expanded. Following that peak, the share gradually declined through the 2010s, stabilizing in the mid-30% range.
The COVID-19 pandemic drove another temporary surge. Expanded credits and economic disruptions pushed the share of non-paying returns to 37.4% in 2020 and 35.0% in 2021. As these temporary measures phased out and economic conditions improved, the share declined to 31.4% in 2022 and further to 30.5% in 2023.
The implementation of the Tax Cuts and Jobs Act (TCJA) marked a structural shift. By nearly doubling the standard deduction and expanding tax relief for lower- and middle-income households, the law contributed to a renewed increase in the share of non-paying filers, rising from 32.1% in 2017 to 34.7% in 2018. This taxpayer safeguard was made permanent in the One Big Beautiful Bill Act of 2025.
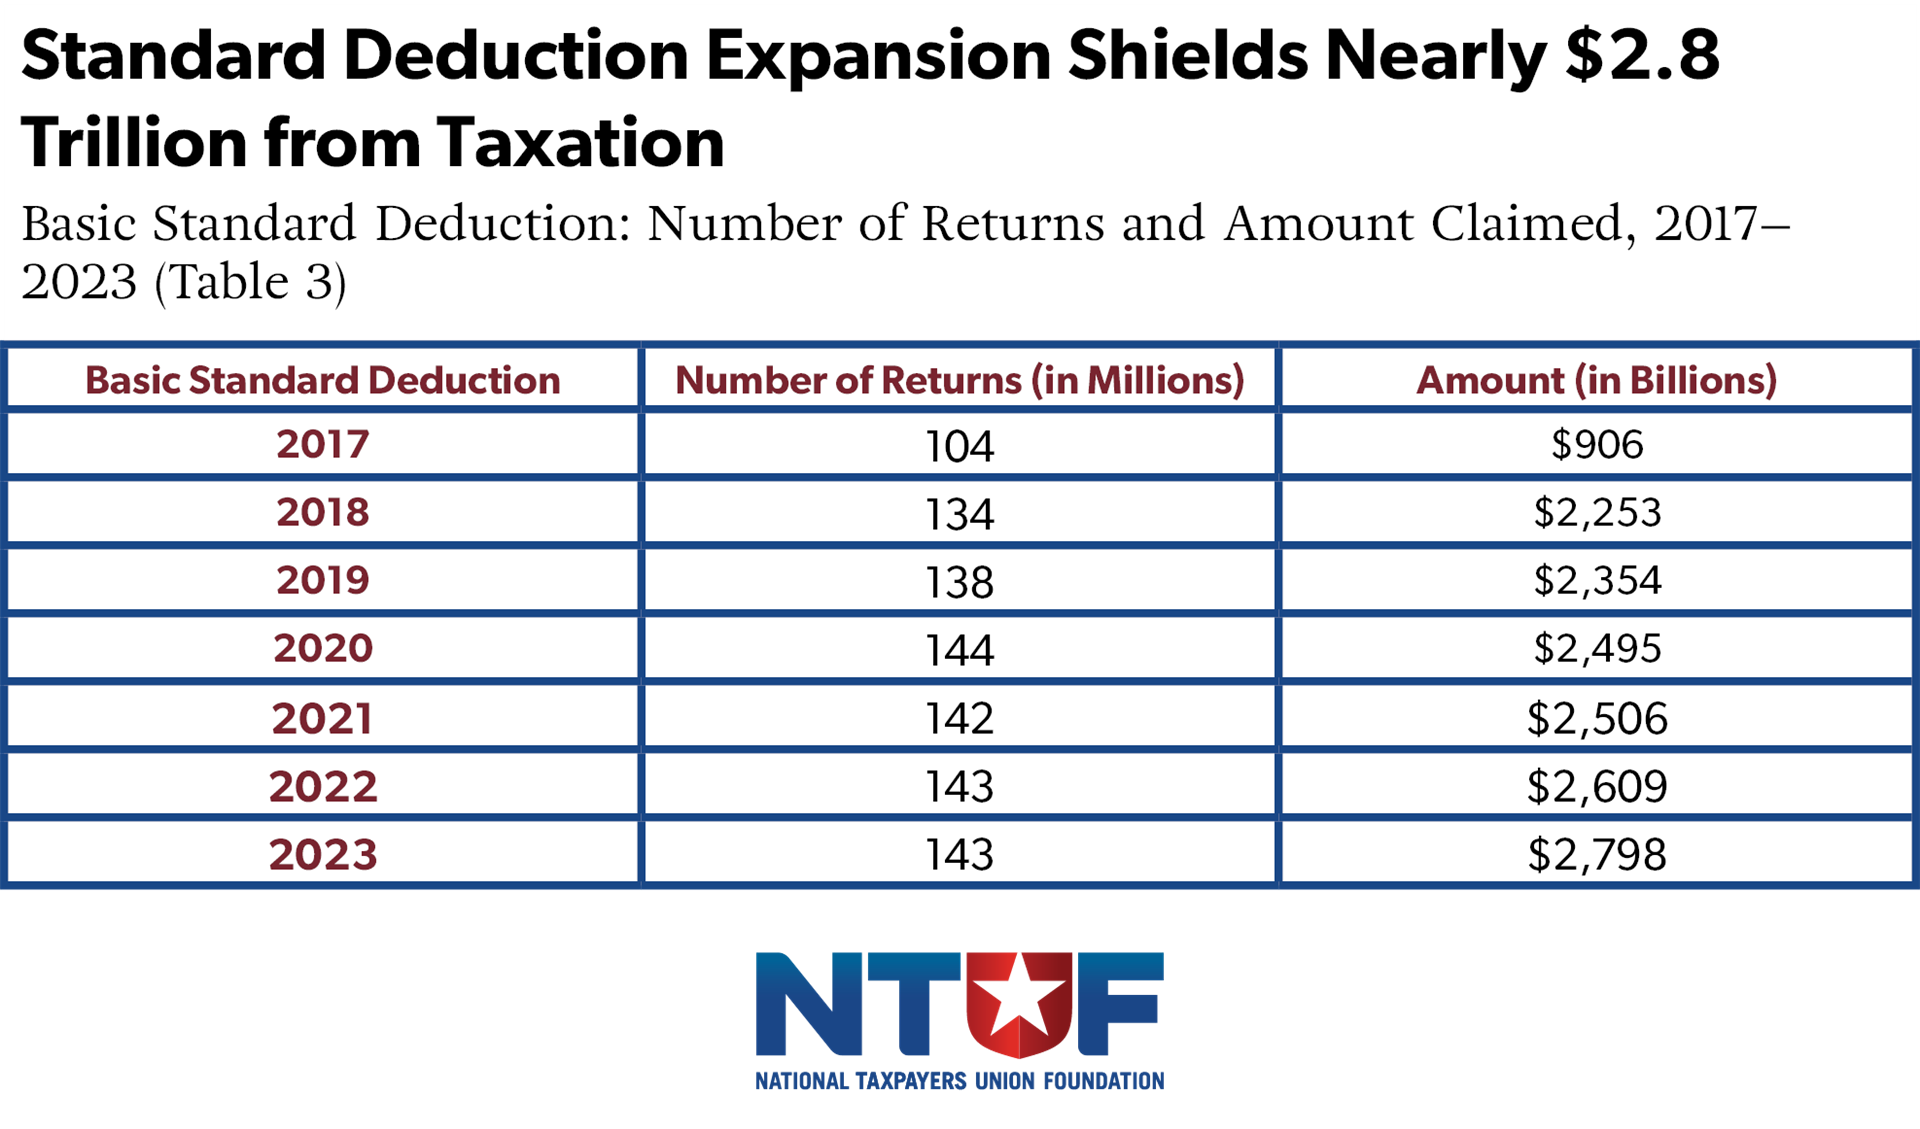
As shown in Table 3, the expansion of the standard deduction significantly increased both the number of filers claiming it and the total amount of income shielded from taxation. The number of returns claiming the standard deduction rose from 104 million in 2017 to 143 million in 2023 as more filers can use this simple deduction rather than itemizing, which also simplifies tax filing, freeing up hundreds of millions of tax compliance hours[7] . Over the same period, the total value of the deduction more than tripled, from $906 billion to nearly $2.8 trillion.
 The expansion of the standard deduction, along with other credits and deductions regularly created or expanded, has a direct effect on tax liability by reducing taxable income across a broad swath of filers, helping to push more households below the threshold at which they owe federal income taxes.
These changes have not only increased the number of non-paying filers but have also contributed to a broader shift in how the income tax burden is distributed.
Although the top federal income tax rate has declined significantly from 70% in 1980 to below 40% today, the federal income tax system has become more progressive over time. In 1980, the top 1% of earners paid 19.3% of all federal income taxes; by 2023[9] , their share had risen to 38.4%. Meanwhile, the bottom 50% of filers saw their share fall from roughly 7% in 1980 to just over 3% in 2023.
At the same time, the share of filers with no income tax liability has increased from about one-fifth in 1980 to roughly one-third today. Together, these trends reflect a tax code that increasingly concentrates the income tax burden among higher earners while shielding a larger share of lower-income households from liability.
It is important to note that filers with no federal income tax liability often still pay other federal taxes. Most workers are subject to payroll taxes that fund Social Security and Medicare, which are applied at a flat rate beginning with the first dollar of wages. Others may owe self-employment taxes or face indirect federal tax burdens embedded in business taxes.
However, even when these additional taxes are taken into account, the overall federal tax system remains progressive. An analysis by the Tax Foundation incorporating income, payroll, and other federal taxes shows that higher-income households pay a larger share of total federal taxes relative to their share of income.
Conclusion
The latest IRS data show that the share of filers owing no federal income tax has declined for two consecutive years, reflecting an improving economy in 2023 and 2024 following the pandemic-era spike. Even with this recent decline.
The longer-term trend is clear: the income tax system is highly progressive, with a growing share of filers owing no income tax and higher earners paying an increasing share of the total.
But progressivity is only part of the story. Millions of taxpayers still spend significant time and resources complying with a system that often results in no income tax owed. While the standard deduction expansion provides relief while easing compliance burden, other types of credits, such as “refundable credits,” provide targeted relief yet raise compliance and administrative burdens, and present the risk of fraud and improper payments that undermines confidence in tax administration.
As lawmakers revisit tax policy, the goal should not simply be to adjust who pays, but to improve how the system works. A tax code that shields income from taxation should not also impose unnecessary complexity or invite abuse. Simplifying the code, strengthening oversight while ensuring taxpayer rights, and improving taxpayer services would help ensure the system is both fair and effective.