

By Demian Brady
February 8, 2019
(pdf)
Introduction
The Congressional Budget Office (CBO) has published its annual report laying out a projection of the economy and the federal budget. CBO’s report serves the purposes of establishing the baseline for federal spending and revenues, and provides policymakers and taxpayers with a picture of how current-law policies will shape the budgetary landscape over the next decade. Moreover, any legislative policy proposals will be scored against this baseline to determine their potential changes on outlays and revenues. Because the federal government tends to spend far in excess of tax receipts, the budget outlook provides a grim reminder every year that deficit spending is piling up a mountain of debt.
There are a ton of facts, figures, analyses, and explanation of assumptions in the 170-page report, but the main takeaways to consider are the current state of the federal government’s fiscal position and the trends that will drive the budget over the next decade. CBO projects that this year’s deficit will reach $897 billion. By 2029, based on CBO’s projection of spending and tax receipts under current law, annual deficits will grow by $47 billion per year.
Unfortunately, the budgetary rules and laws set by Congress require CBO to establish this budget projection based on current law, which gives the appearance of producing less red ink than is likely. An alternative, more realistic view of the budget that takes into account the likely course of tax and budget policy uncovers an additional $4.1 trillion in lower revenues, higher outlays, and increased debt service costs.
Current Deficit
The budget deficit for the Fiscal Year 2019 is expected to reach $897 billion, coming in lower than the $981 billion deficit CBO had forecast a year ago. Nevertheless, this is $118 billion worse than the actual level of deficit spending recorded for FY 2018 and deficits are expected to top $1 trillion by FY 2022.
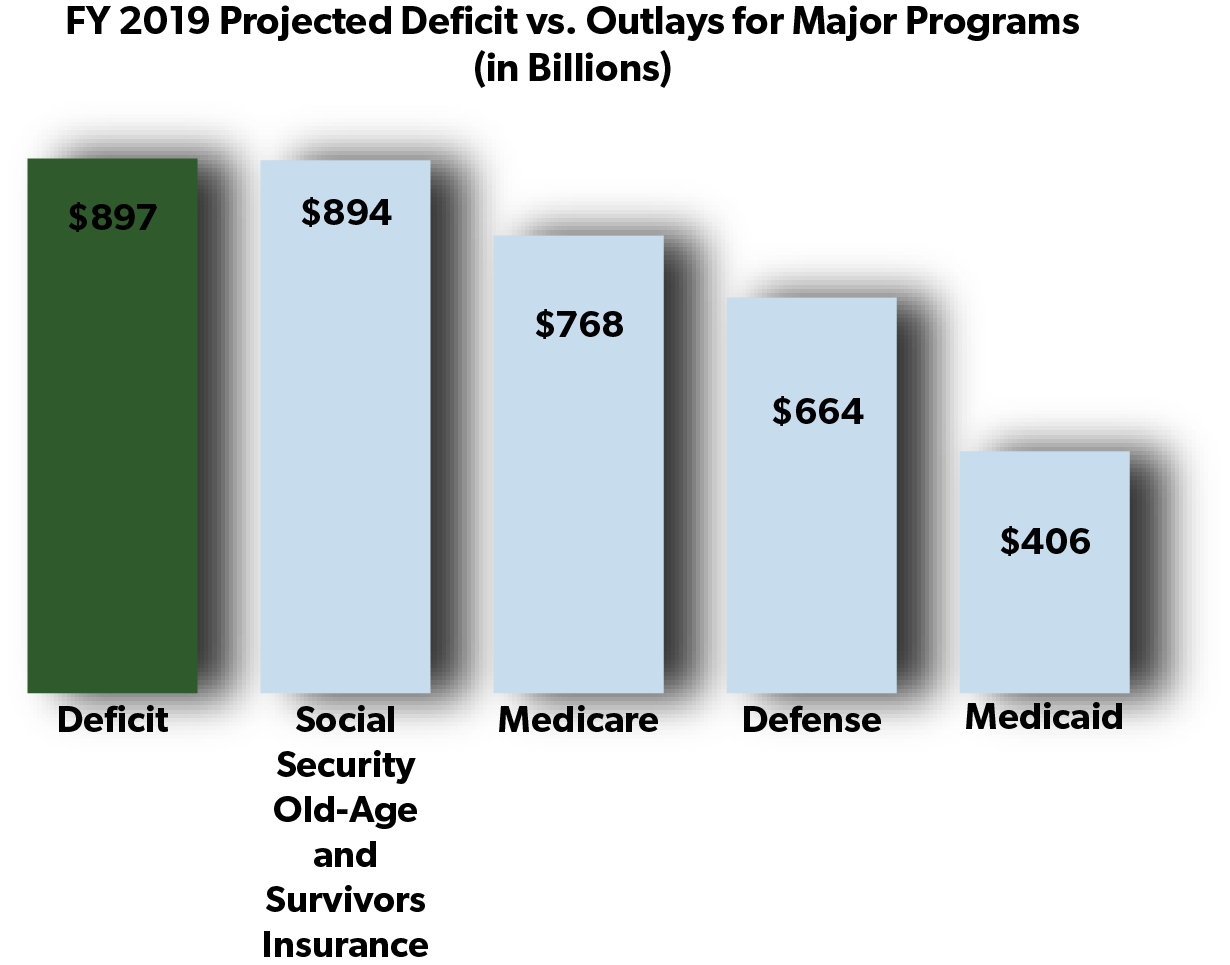
Since 2017, annual deficits have exceeded total defense spending, perhaps the function taxpayers most associate with the federal government. This year, for the first time apart from the recession from 2009 through 2012, the deficit will exceed total outlays in the single largest federal program: Social Security Old-Age and Survivors Insurance (excluding the $145 billion in spending through Social Security’s Disability Insurance program).
The Deficit in Context
Twenty percent of all outlays this year ($4.4 trillion) will be financed through deficit spending.
This year’s deficit equates to two-thirds of all discretionary spending ($1.3 trillion), and easily surpasses the $664 billion budget for defense.
The total deficit is one-third as large as spending on all mandatory programs ($2.7 trillion), exceeding projected outlays for the Old-Age and Survivors Insurance part of Social Security ($894 billion), Medicare ($768 billion) and Medicaid ($406 billion).
Deficit share per U.S. household: $7,358.
The deficit amounts to 4.2 percent of GDP, slightly higher than the average 3.5 percent since 2000.
The deficit is larger than the nominal GDP of all but 16 countries, coming in ahead of Turkey which has a nominal GDP of $850 billion.
According to the Endowment for Human Development, the height of a stack of 100,000,000 (one hundred million) one dollar bills measures 35,851 feet or 6.79 miles. Based on that, a stack of 897 billion one-dollar bills would extend nearly 61,000 miles, nearly a quarter of the way to the moon at its average distance.
Shaping the Ten-year Budget Projection
CBO projects that federal revenues will rise from 16.4 percent of GDP in FY 2018 to 17.4 in 2025. Over this time, corporate income taxes will increase from 1 percent to 1.6 percent, while individual income taxes will average 8.4 percent of GDP. In subsequent years, under CBO’s mandated current-law assumptions, revenues would top 18 percent of GDP, but this would be primarily due to the sunset of individual income tax reductions in the Tax Cuts and Jobs Act (TCJA). If the past is any guide to future congressional actions, lawmakers will act to prevent most or all of these tax hikes from taking effect.
On the other side of the ledger, spending comprises 20.8 percent of GDP this year and will rise to 23 percent in 2029, driven largely by entitlement programs such as Social Security, Medicare, and Medicaid. Entitlement spending now comprises 61 percent of federal outlays, up from 53 percent at the start of this century. As the population continues to age, entitlement spending is projected to grow by $189 billion annually, comprising nearly two-thirds of outlays in a decade.
Discretionary spending is expected to reach $1.3 trillion in FY 2019, with $664 billion for defense and $670 billion for non-defense spending. Over the decade, defense spending is projected to grow by $10.7 billion annually, outpacing non-defense outlays starting next year.
Discretionary spending comprises less than a third of all outlays, diminishing to 22 percent in ten years. Although discretionary outlays will continue to shrink as a share of total spending, there are opportunities to further reduce or at least slow the growth of discretionary programs by reducing bureaucracy or eliminating wasteful and duplicative programs, but the budgetary math clearly illustrates that lawmakers will not be able to make a meaningful dent in the deficit without entitlement reform.
Historical Average of Outlays and Revenues
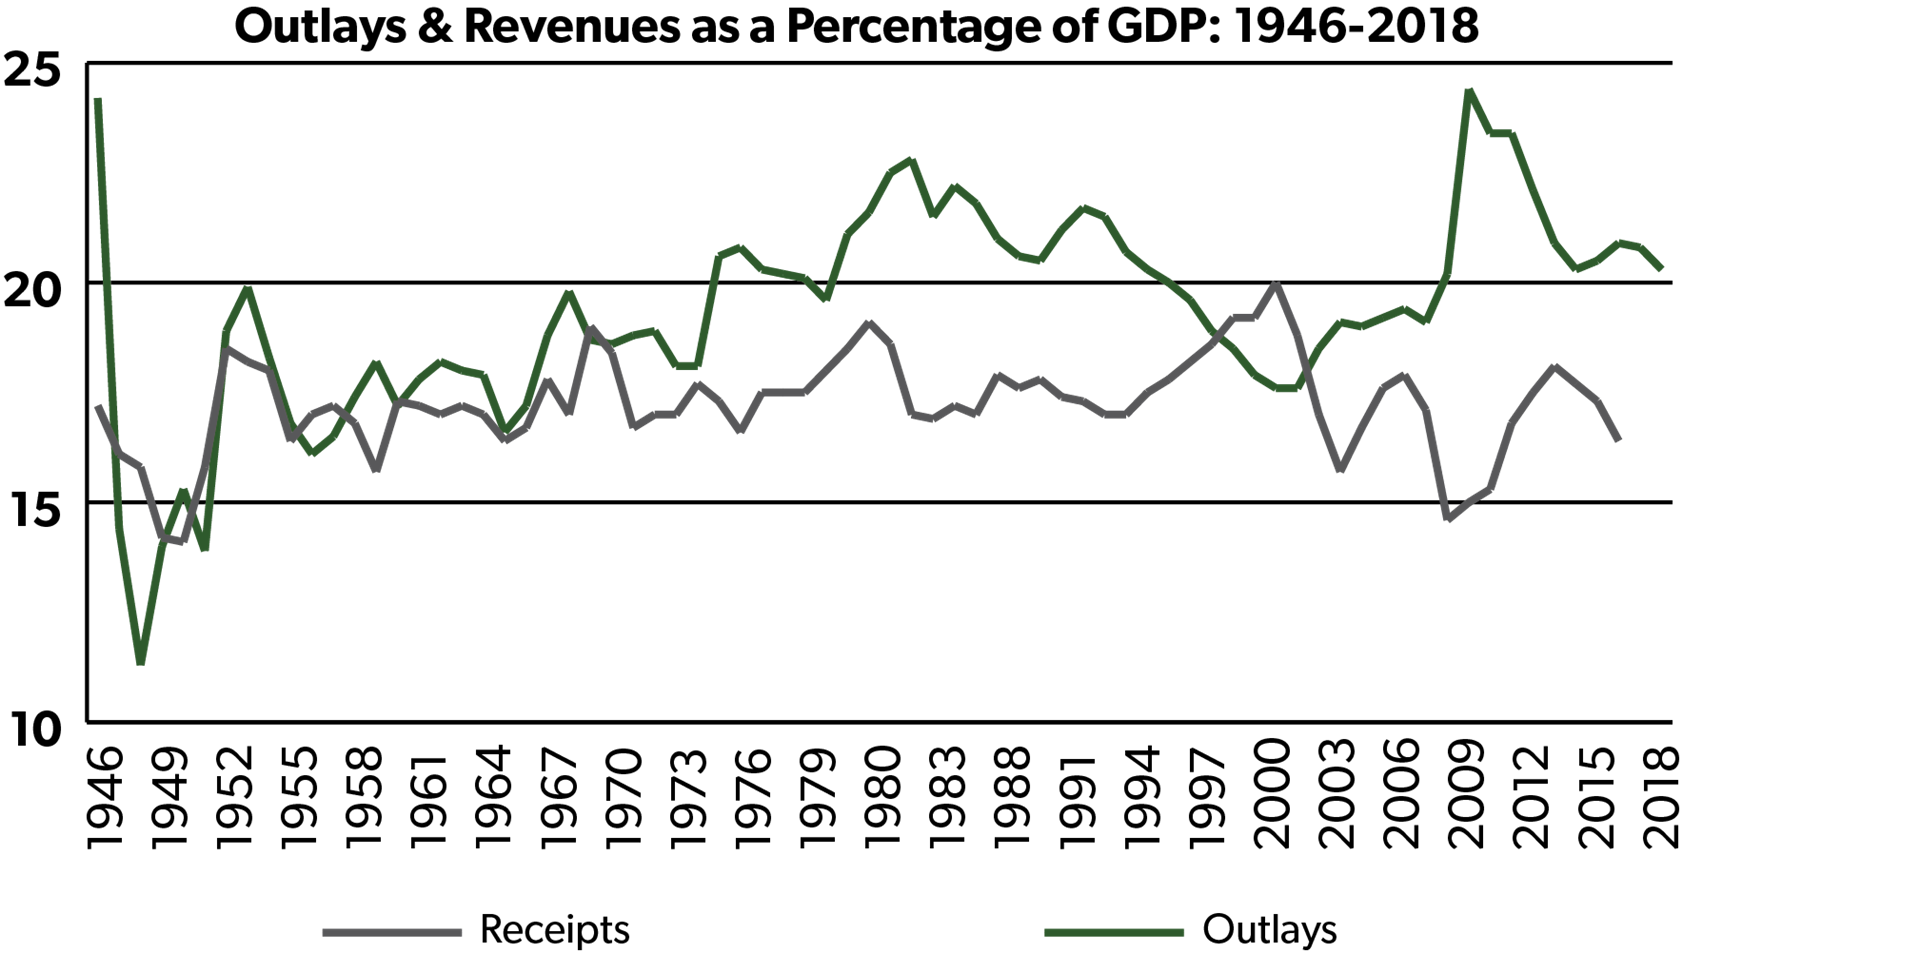
Under the current baseline projection for FY 2019, outlays are expected reach 20.8 percent of GDP, while revenues will flow in at 16.5 percent. Since the end of World War II, revenues have averaged 17.2 percent (ranging from a low of 14.1 percent in 1950 to a high of 20 percent in 2000) while outlays have been running at 19.4 percent (ranging from 11.3 percent in 1948 to 24.4 percent in 2009). This reflects a colossal failure to budget accordingly. After the passage of the TCJA to reduce taxes and reform the tax code, lawmakers knew that revenues would decline over the short-term as the tax cuts helped fuel economic growth. However, just a few months later, Congress enacted the Bipartisan Budget Act, which increased the statutory caps on spending. Lawmakers could not even agree to enact the President’s stand-alone rescissions package that would have trimmed unused and expired budget authority by $15 billion over ten years, and instead used them as bogus offsets to a spending bill later in the year.
Constructing a Realistic Baseline
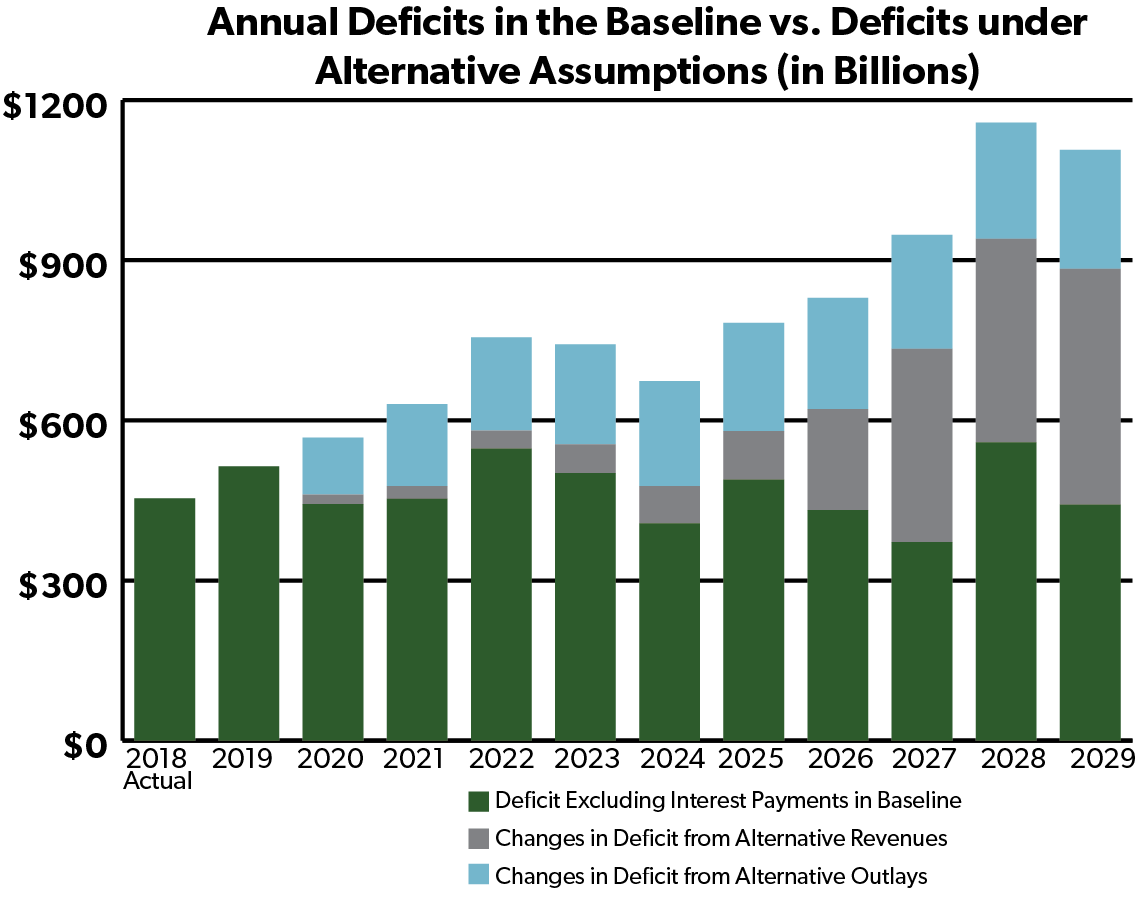
As bad as CBO’s budget projection already is, using more realistic assumptions about the trajectory of revenues and outlays reveals an additional $4.1 trillion piled onto the deficit.
Revenue Adjustments
Revenues in CBO's Current-Law Baseline vs. Adjusted Policy Baseline (in Billions) | |||||||||||
2019 | 2020 | 2021 | 2022 | 2023 | 2024 | 2025 | 2026 | 2027 | 2028 | 2029 | |
Revenues in CBO's Baseline | $3,515 | $3,686 | $3,841 | $4,012 | $4,208 | $4,448 | $4,647 | $4,956 | $5,254 | $5,446 | $5,672 |
Extend certain provisions of the 2017 | * | -$3 | -$4 | -$4 | -$5 | -$5 | -$12 | -$98 | -$257 | -$275 | -$295 |
Extend the expansion of bonus | $0 | $0 | $0 | $0 | -$9 | -$19 | -$27 | -$32 | -$36 | -$29 | -$23 |
Extend other expiring revenue provisions | * | -$1 | -$4 | -$5 | -$8 | -$9 | -$11 | -$13 | -$15 | -$17 | -$20 |
Repeal certain postponed health taxes | $0 | -$15 | -$16 | -$25 | -$33 | -$37 | -$42 | -$46 | -$54 | -$59 | -$66 |
Subtotal of Change in Revenues | $0 | -$18 | -$24 | -$34 | -$54 | -$70 | -$91 | -$189 | -$362 | -$381 | -$403 |
Revenues in Adjusted Baseline | $3,515 | $3,668 | $3,817 | $3,978 | $4,154 | $4,378 | $4,556 | $4,767 | $4,892 | $5,065 | $5,269 |
* = between -$500 million and $500 million. Sums may not total due to rounding. | |||||||||||
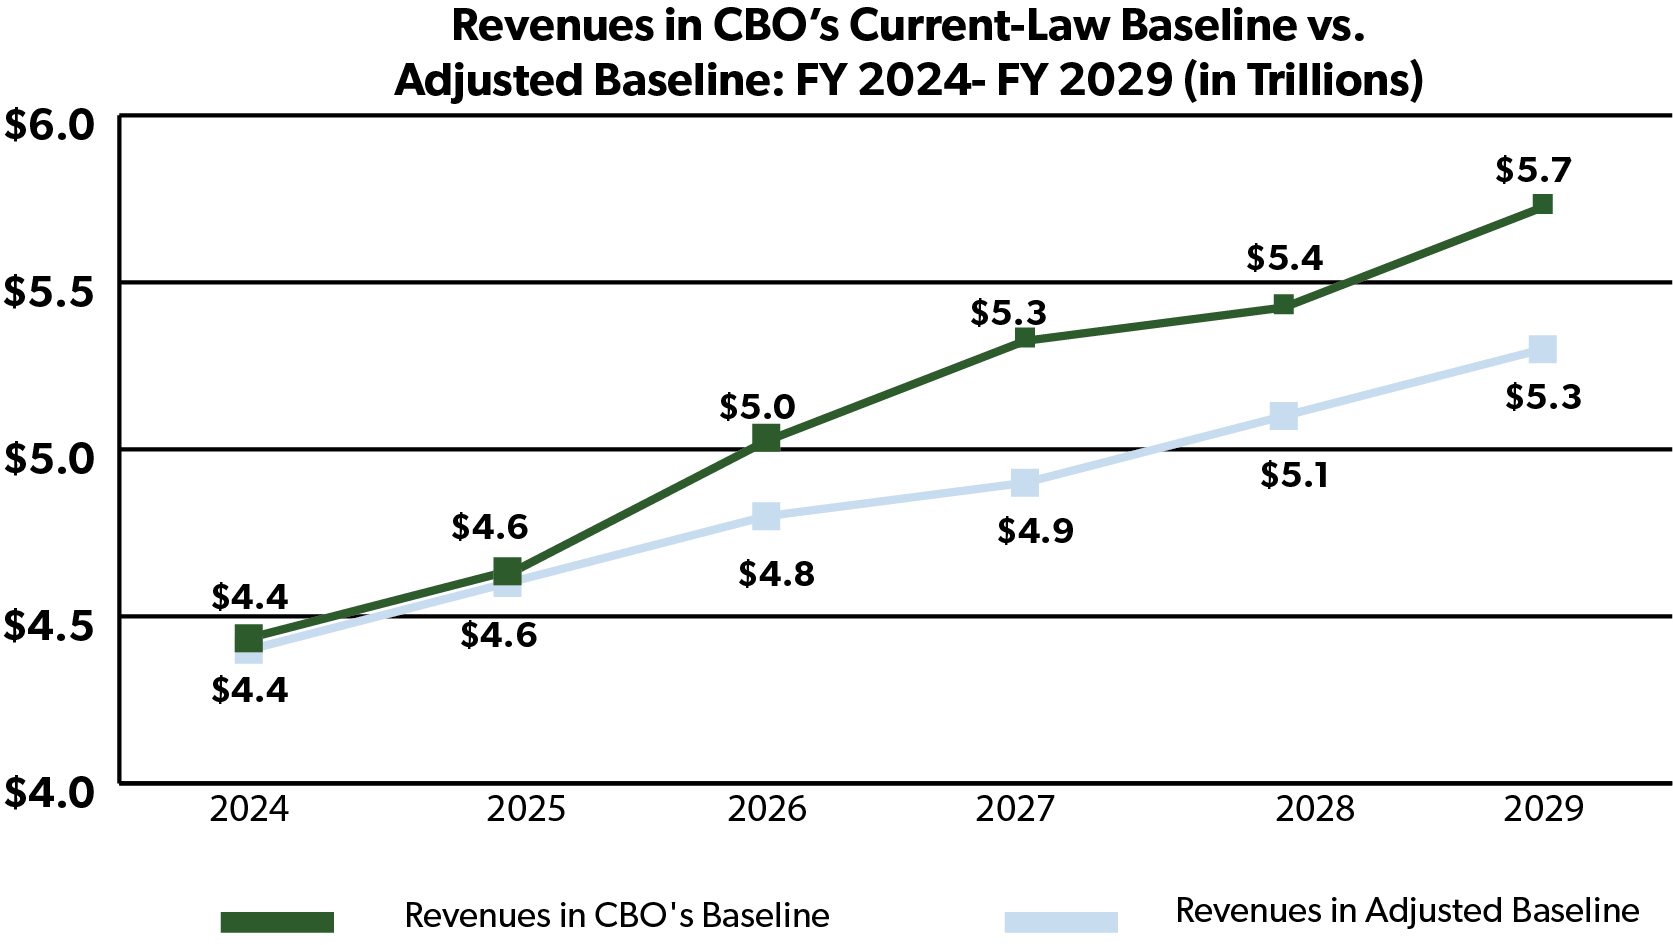
CBO projects revenues based on current-law, which includes the sunset of many provisions included in the TCJA at the end of 2025, including the individual income reductions and brackets, and the expansion and refundability of the child tax credit. Previously enacted tax cuts that included similar sunset dates were eventually continued, preventing massive hikes on taxpayers. It is fair to assume that these provisions of the TCJA will also be extended. The Joint Committee on Taxation (JCT) estimates that doing so would decrease revenues by $21 billion through 2024 and by $957 billion over the decade.
Similarly, the TCJA includes a phase-out of a provision known as bonus depreciation that permits businesses to immediately deduct the cost of certain investments. JCT projects making this provision permanent would decrease revenues by $174 billion over ten years. Making the 100 percent bonus depreciation permanent would also contribute to long-term growth in GDP. The Tax Foundation estimated that permanent full expensing would decrease revenues by $141 billion using a conventional analysis. Under an alternative dynamic analysis accounting for additional economic growth from enacting the provision, the Tax Foundation calculated that full expensing would on net reduce revenues by $98 billion - recovering 70 percent of the foregone revenues.
CBO’s official baseline also includes taxes that were originally enacted in the Affordable Care Act (ACA) but that have been either suspended or delayed, including the medical device excise tax, the “Cadillac” excise tax on high-cost employer health care plans, and a tax on health insurance providers. Excluding these would decrease estimated revenue by $392 billion through 2029.
CBO also notes that there are “more than 20 tax provisions [that] expire between December 31, 2018, and the end of the projection period,” commonly known as extenders. These include renewable energy credits and trade preference programs established for developing countries. While extension is less certain than in previous Congresses, it is likely that some provisions will continue. Extending all of them would further decrease revenues by $103 billion through 2029.
Making these concessions to the likely course of policy, the adjusted realistic revenue baseline would be $1.6 trillion lower, 46 percent of the total increase in the deficit.
Outlay Adjustments
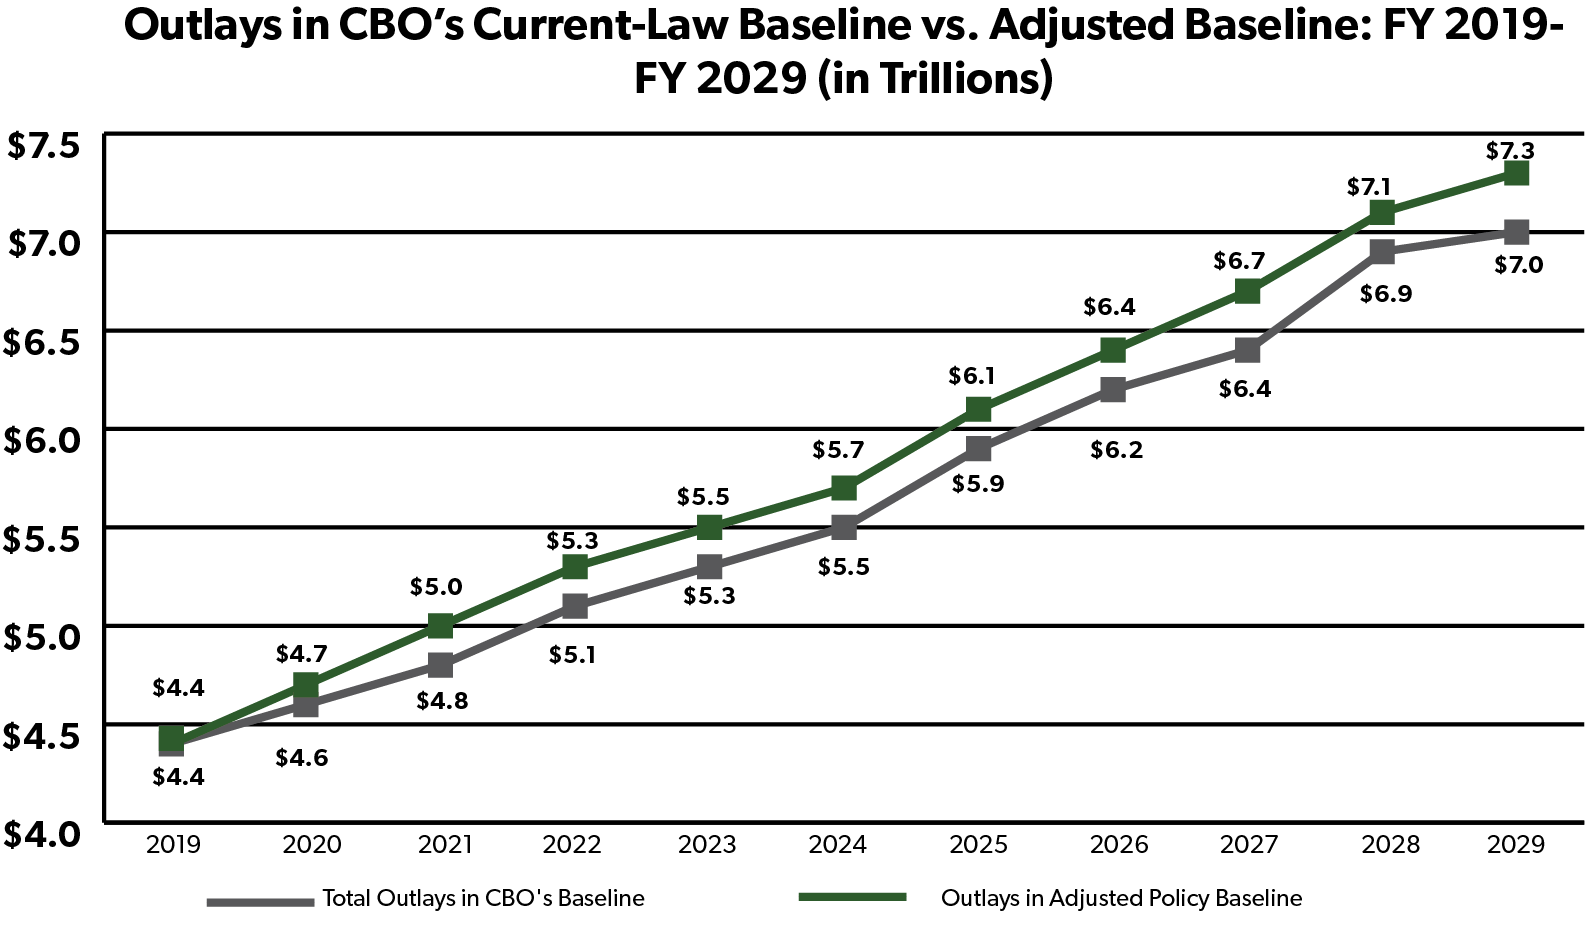
CBO’s baseline assumes that the caps on spending enacted in the Budget Control Act of 2011 would be maintained, but Congress has increased the caps multiple times in order to allow for $439 billion in higher spending. CBO projected that if the spending that would otherwise be limited by the caps were instead increased at the rate of inflation, outlays would run $1.8 trillion higher than in the statutory baseline.
Outlays in CBO's Current-Law Baseline vs. Adjusted Policy Baseline (in Billions) | |||||||||||
2019 | 2020 | 2021 | 2022 | 2023 | 2024 | 2025 | 2026 | 2027 | 2028 | 2029 | |
Outlays in CBO's Baseline | $4,412 | $4,589 | $4,814 | $5,140 | $5,347 | $5,539 | $5,859 | $6,160 | $6,446 | $6,881 | $7,042 |
Discretionary Outlays continue at rate of inflation | $0 | $97 | $144 | $165 | $178 | $187 | $193 | $199 | $204 | $208 | $213 |
Additional Emergency Non-Defense Outlays | $10 | $10 | $10 | $10 | $10 | $10 | $10 | $10 | $10 | $10 | $10 |
Subtotal of Change in Revenues | $10 | $107 | $154 | $175 | $188 | $197 | $203 | $209 | $214 | $218 | $223 |
Outlays in Adjusted Baseline | $4,422 | $4,696 | $4,968 | $5,315 | $5,535 | $5,736 | $6,062 | $6,369 | $6,660 | $7,099 | $7,265 |
Figures may not total due to rounding. | |||||||||||
Using a more realistic projection of emergency spending that is not subject to any caps would also yield $9.6 billion more outlays per year than are included in the baseline. CBO notes that its new projection of the deficit through 2028 is $774 billion lower than the projection it produced a year ago “almost entirely because the baseline includes less emergency spending than it did previously.” Congress enacted $102 billion in emergency non-defense discretionary outlays during 2018, largely for disaster relief. Building this figure into last year’s baseline drove up the forecast of outlays. So far for FY 2019, lawmakers have provided $1.7 billion in emergency spending, thus making the current ten-year deficit projection look smaller than an assumption that accounts for the recent historical average. From 2012 through 2017, emergency outlays averaged $11.3 billion per year (including 2018 levels, the average would be $24.3 billion, but that was likely an outlier year due to the devastating hurricanes), $9.6 billion higher than the current amount in the baseline.
In total, these adjustments would widen the deficit by 1.8 trillion from 2019 through 2029, 54 percent of the total changes made to construct a realistic policy baseline.
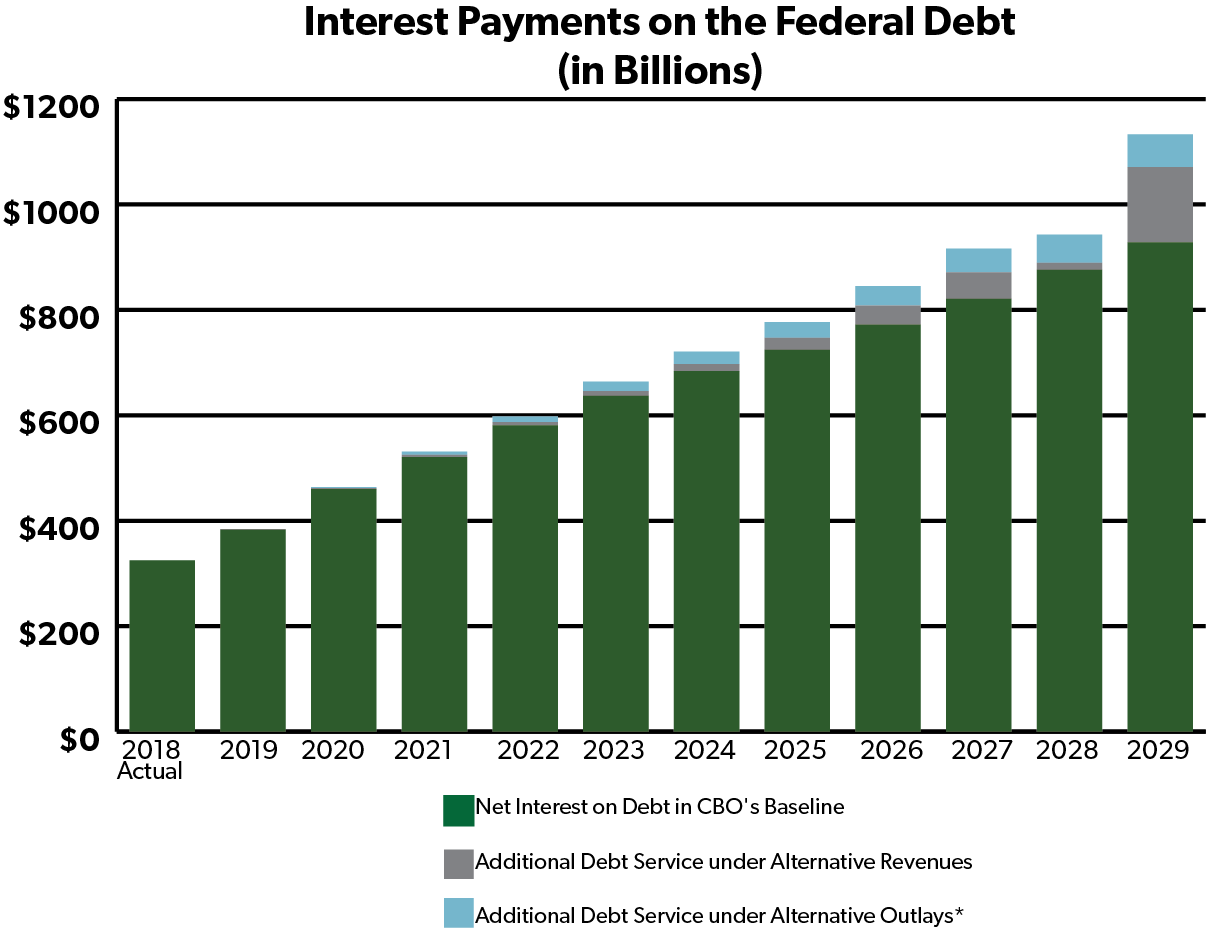
The cost of financing the government’s perpetual overspending are set to increase in the baseline, nearly tripling from $325 billion in 2018 to $928 billion in 2029. That would top the projected outlays that year for defense ($771 billion) and Medicaid ($702 billion).
The alternative revenue assumptions to extend the expiring provisions of the TCJA, eliminating the pending ACA taxes, and the additional changes discussed above would revenue change would increase debt service costs by $300 billion. Eliminating the discretionary spending caps would increase debt interest payments by $290 billion. The costs could be substantially higher if interest rates turn out to be higher than projected. CBO estimates that if interest rates are 0.1 percent higher per year, the ten-year deficit would be $182 billion higher than its baseline projection.
Conclusion
Because of strictures placed on it by Congress, CBO must produce its policy baseline according to assumptions that most people in Washington know are inaccurate. For years, Congress has made a regular practice of taking actions that exacerbate the deficit, like waiving budget caps or extending tax relief, which are not reflected in current law. By making these common-sense adjustments, we can produce a realistic policy baseline that more accurately reflects the likely fiscal course our nation will have to navigate in coming years.
Unfortunately, this more realistic assessment uncovers $4.1 trillion in additional deficits than is reported under CBO’s ordinary baseline. This new red ink will drive debt held by the public up from its current 78 percent of GDP, causing interest payments to double as a share of the budget absent a serious course correction. This realistic policy baseline is a stark reminder that Congress has difficult work ahead of it to put its fiscal house in order.