
The nonpartisan Congressional Budget Office (CBO) just released their preliminary budget deficit estimate for fiscal year (FY) 2022, which ended on September 30. Their verdict? The federal government spent $1.377 trillion more than it took in – high by historical standards but lower than the deficits during the first two years of the pandemic.
Overall, in the three fiscal years encompassing the pandemic (2020-22), the U.S. government has run deficits totaling $7.285 trillion, or nearly $22,000 for every man, woman, and child in America.
The close of any fiscal year offers budget watchdogs, including NTU Foundation, the opportunity to review expectations and realities for the just-closed fiscal year and for years prior to that.
For example, CBO highlights that the 2022 budget deficit of $1.377 trillion is significantly lower than deficits in each of the past two fiscal years, which totaled $3.132 trillion (2020) and $2.776 trillion (2021). The 2022 deficit was lower because revenue was up $850 billion (21 percent) from 2021 levels, and spending was down $549 billion (eight percent) from 2021 levels.
CBO also reviewed how spending in certain categories changed from 2021 to 2022. For example, funding to the Small Business Administration, for unemployment compensation, and on refundable tax credits were much lower in 2022 than in 2021 (due to expiring pandemic-era spending), while spending on Medicare, Medicaid, and Social Security were all up. More troublingly, net interest spending on the debt was up an astounding 29 percent. Department of Education spending was up 145 percent due to President Biden’s broad-based cancellation of federal student loan debt.
An even more interesting exercise is to compare federal spending, revenues, and deficits from the past 10 years (2013-22) to what CBO projected such totals would be at the start of that 10-year window.
In its August 2012 baseline, two months prior to the start of FY 2013, CBO projected spending from 2013-22 would total $43.824 trillion, revenue would total $41.565 trillion, and deficits would total $2.258 trillion (the latter averaging $226 billion per year over the 10-year window).
In reality, from 2013 through 2022, spending totaled $46.661 trillion ($2.837 trillion higher than expected), revenues totaled $34.778 trillion ($6.787 trillion lower than expected), and deficits totaled $11.902 trillion ($9.644 trillion higher than expected, and an average of $1.19 trillion per year over the 10-year window). Projected and actual deficits are illustrated below:
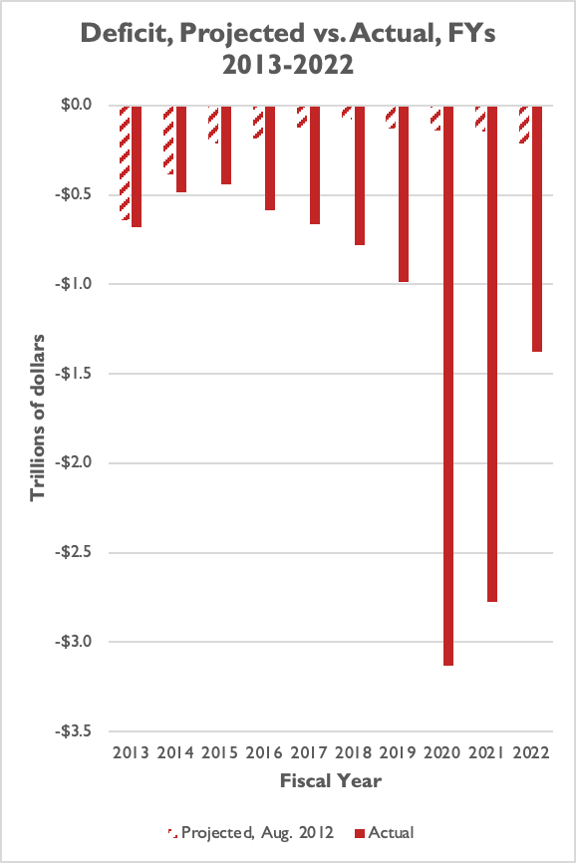
The pandemic is the clear driving force here. In the seven non-pandemic years of this 10-year window, deficits totaled $4.617 trillion, an average of $660 billion per year. In the three pandemic years, deficits have totaled $7.285 trillion, an average of $2.428 trillion per year.
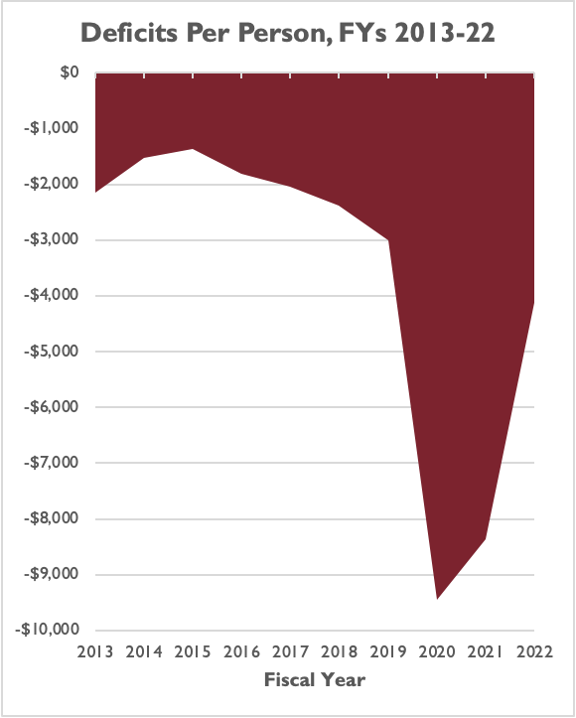
To illustrate this in a clearer fashion for non-budget wonks, consider deficits over these 10 years per person in the U.S.
Deficits from 2013 through 2018 ran between $1,368 and $2,383 per person in America. In 2019, the federal deficit approached $3,000 per person. In 2020, the deficit totaled $9,448 per person. Deficits were $8,364 per person in 2021 and $4,133 per person in the most recent fiscal year, 2022.
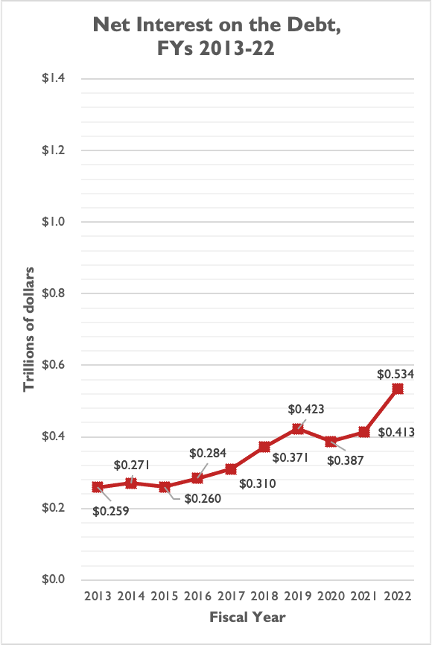
One severe consequence of rising deficits and debt is rising interest payments on the debt. Interest on the debt does not benefit current or future taxpayers – it is the present-day burden of decisions policymakers made in the past to borrow and spend instead of balancing the federal budget. Rising interest payments also siphon revenue away from mandatory programs that millions of Americans rely on (e.g. Social Security, Medicare, and Medicaid), discretionary programs that are important to the country’s security and prosperity (e.g. military spending, education spending), and national needs based on future, unforeseen events (e.g. national security incidents, natural disasters, global pandemics).
Interest payments averaged around $300 billion per year from 2013 through 2018. In 2019, interest payments surpassed $400 billion in a year for the first time. After dipping below $400 billion again in 2020, interest payments were $413 billion in 2021 and a jaw-dropping $534 billion in 2022.
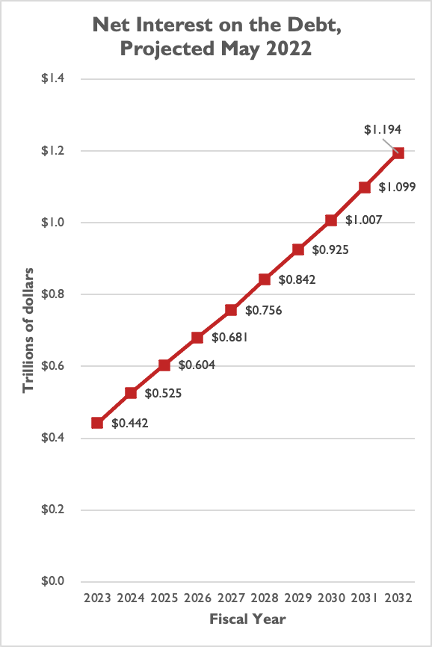
Unfortunately, interest payments in the past year pale in comparison to projected interest payments on the national debt in the next 10 years. This is due to both a) rapidly rising debt levels and b) rising interest rates as a result of Federal Reserve policy decisions in response to persistently high inflation. Interest payments on federal debt will surpass $750 billion per year in 2027, and will hit $1 trillion or more per year in 2030.
According to CBO, interest on the debt will eat up a larger share of the federal budget than the entire military budget by the end of the decade.
This path is unsustainable. Deficits are coming down from pandemic-level highs, but with stubbornly high inflation, high interest rates, and a possible recession around the bend, America’s fiscal position looks as perilous as ever. Deficits could even bounce back up if:
- Revenues come in lower than expected due to an economic downturn (which will affect individual income tax receipts, payroll tax receipts, and corporate income tax receipts);
- Spending is higher than expected (due to both new fiscal supports enacted in response to an economic downturn and Congress extending certain policies scheduled to expire); and/or
- Interest rates are higher than expected (increasing net interest payments on the debt).
Nearly $12 trillion in deficits over 10 years was probably an unthinkable proposition in August 2012, but that is precisely what happened over the ten-year fiscal window (2013-22). CBO projects nearly $16 trillion in deficits over the next ten-year window (2023-32). Congress is going to need to do a lot of work to ensure that number isn’t much higher than currently projected.