
The nonpartisan Congressional Budget Office (CBO) released their latest budget baseline this week, and the lengthy document provides several important updates for how the legislative branch’s budget and economic experts are projecting federal spending, taxation, debt, and deficits – along with U.S. economic activity – will change in the years to come.
The budget baseline is an important, regular product that CBO releases to Congress and the American public, and earlier this week NTU Foundation’s Demian Brady offered his immediate takeaways on the May 2022 baseline – CBO’s first baseline since July 2021.
To supplement that work, and to help policymakers and taxpayers better understand how CBO sees the federal budget and U.S. economy shaping up in the next decade, below are 13 charts that help explain CBO’s latest projections.
More Revenue Coming In
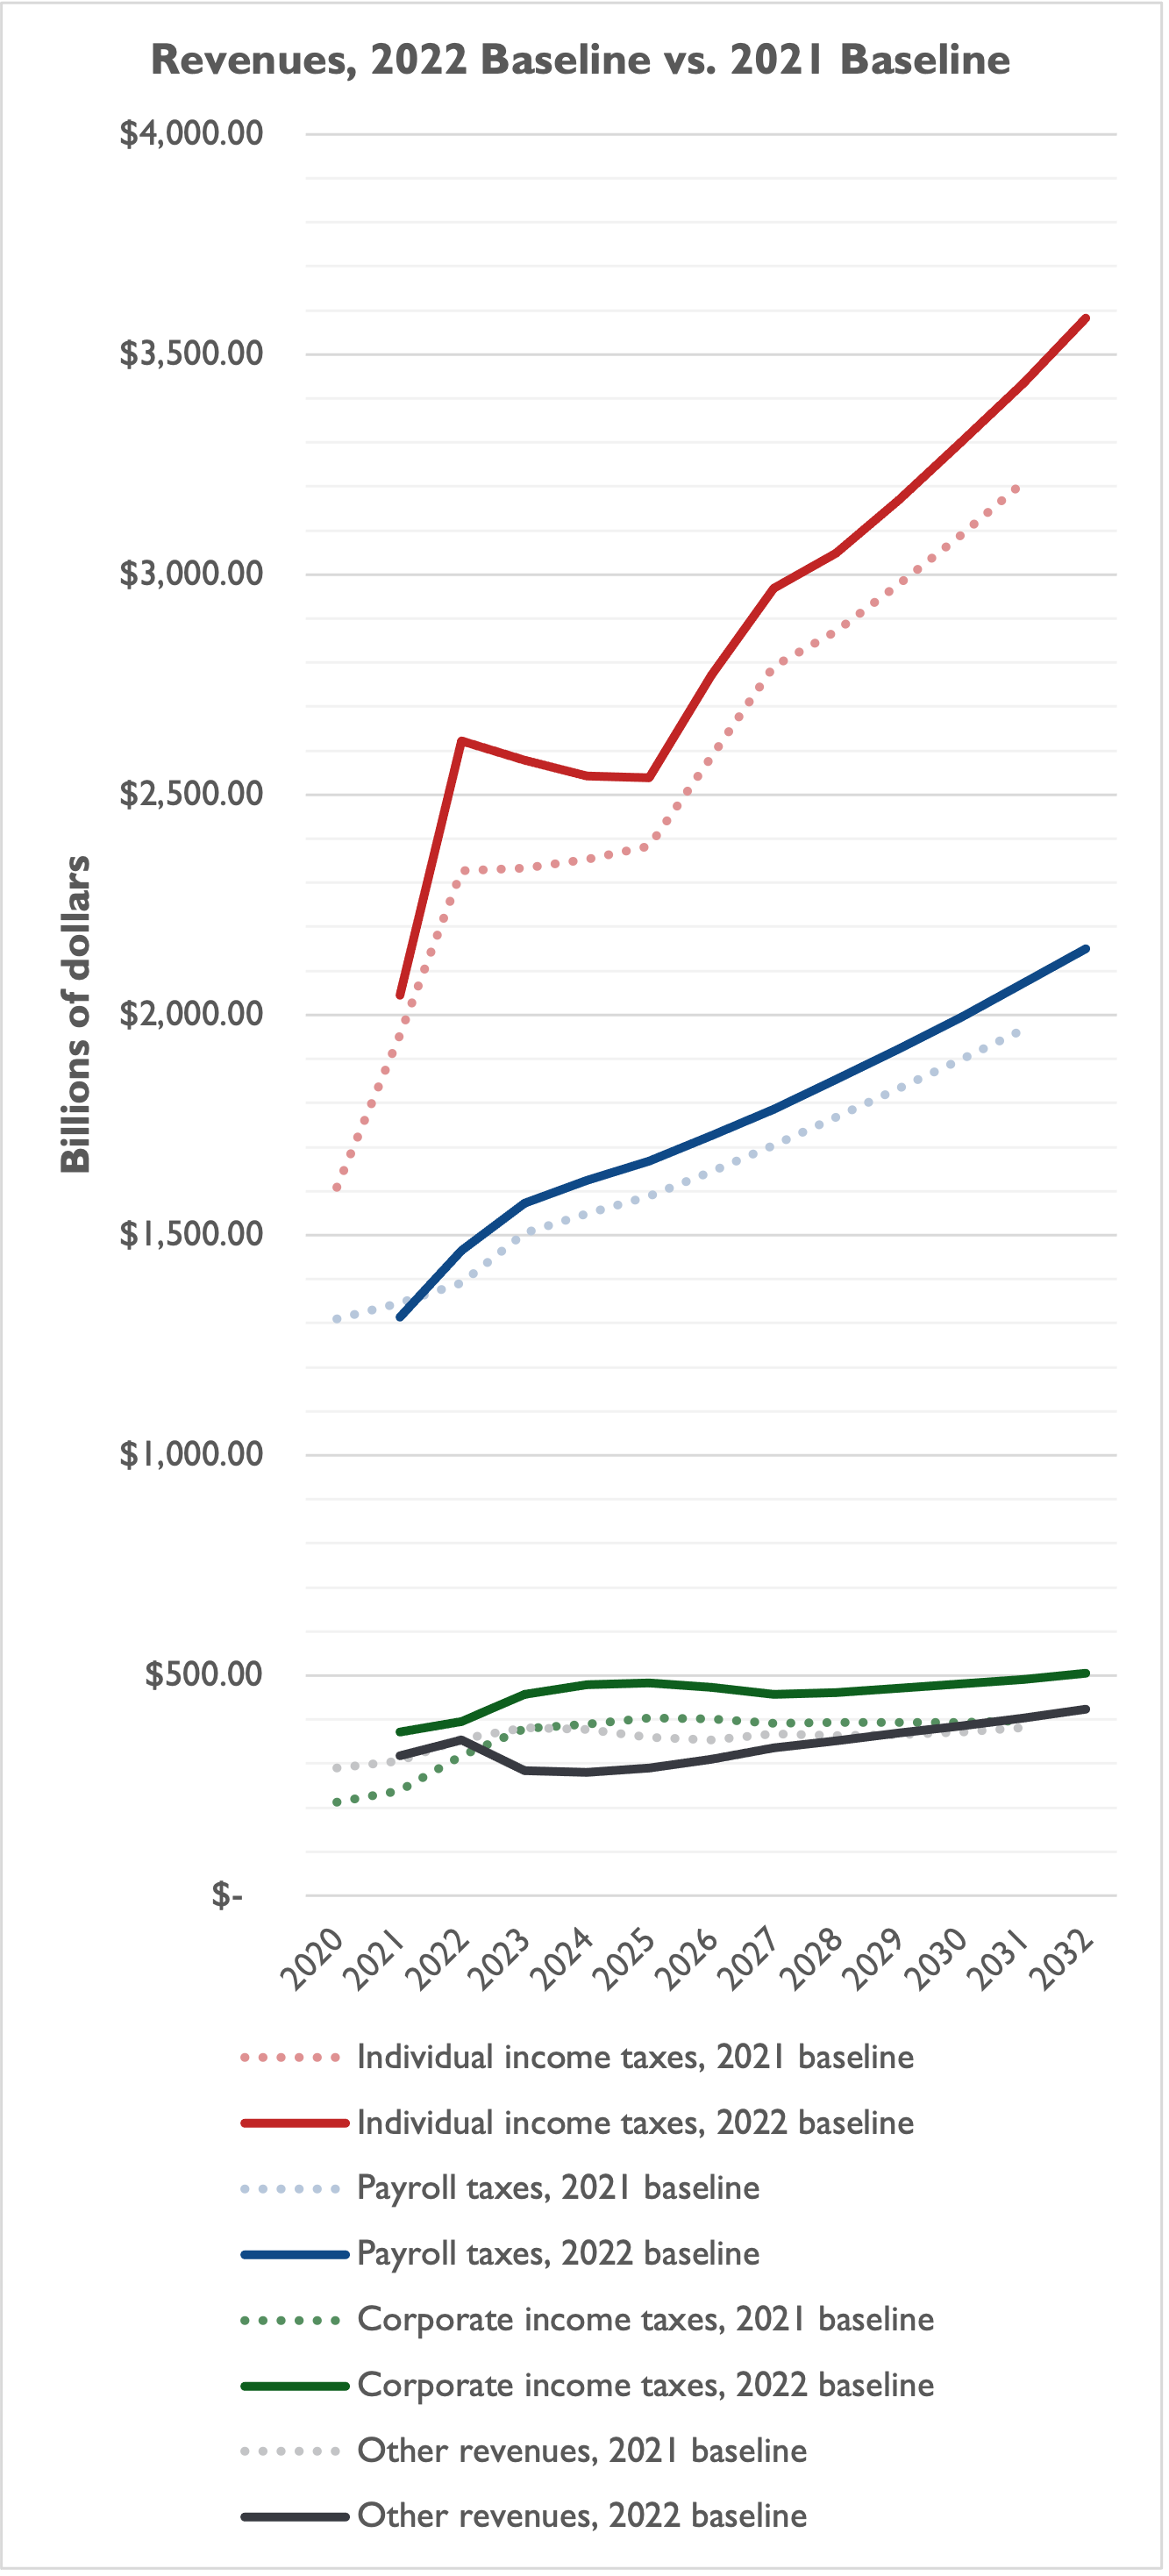
Relative to last July’s baseline, CBO projects the federal government will bring in more individual income tax revenue, payroll tax revenue, and corporate tax revenue from fiscal years (FYs) 2022-2031. The difference over 10 years is about $3.36 trillion, or an average of $336 billion per year. As a share of the size of the nation’s economy, though – gross domestic product (GDP) – revenue will actually decline over the decade. Revenue collections reach a high watermark of 19.58 percent of GDP in FY 2022, according to CBO, before falling to a low of 17.62 percent of GDP in FY 2025 and then leveling out at around 18 percent of GDP for the remainder of the 10-year window.
…and Even More Spending
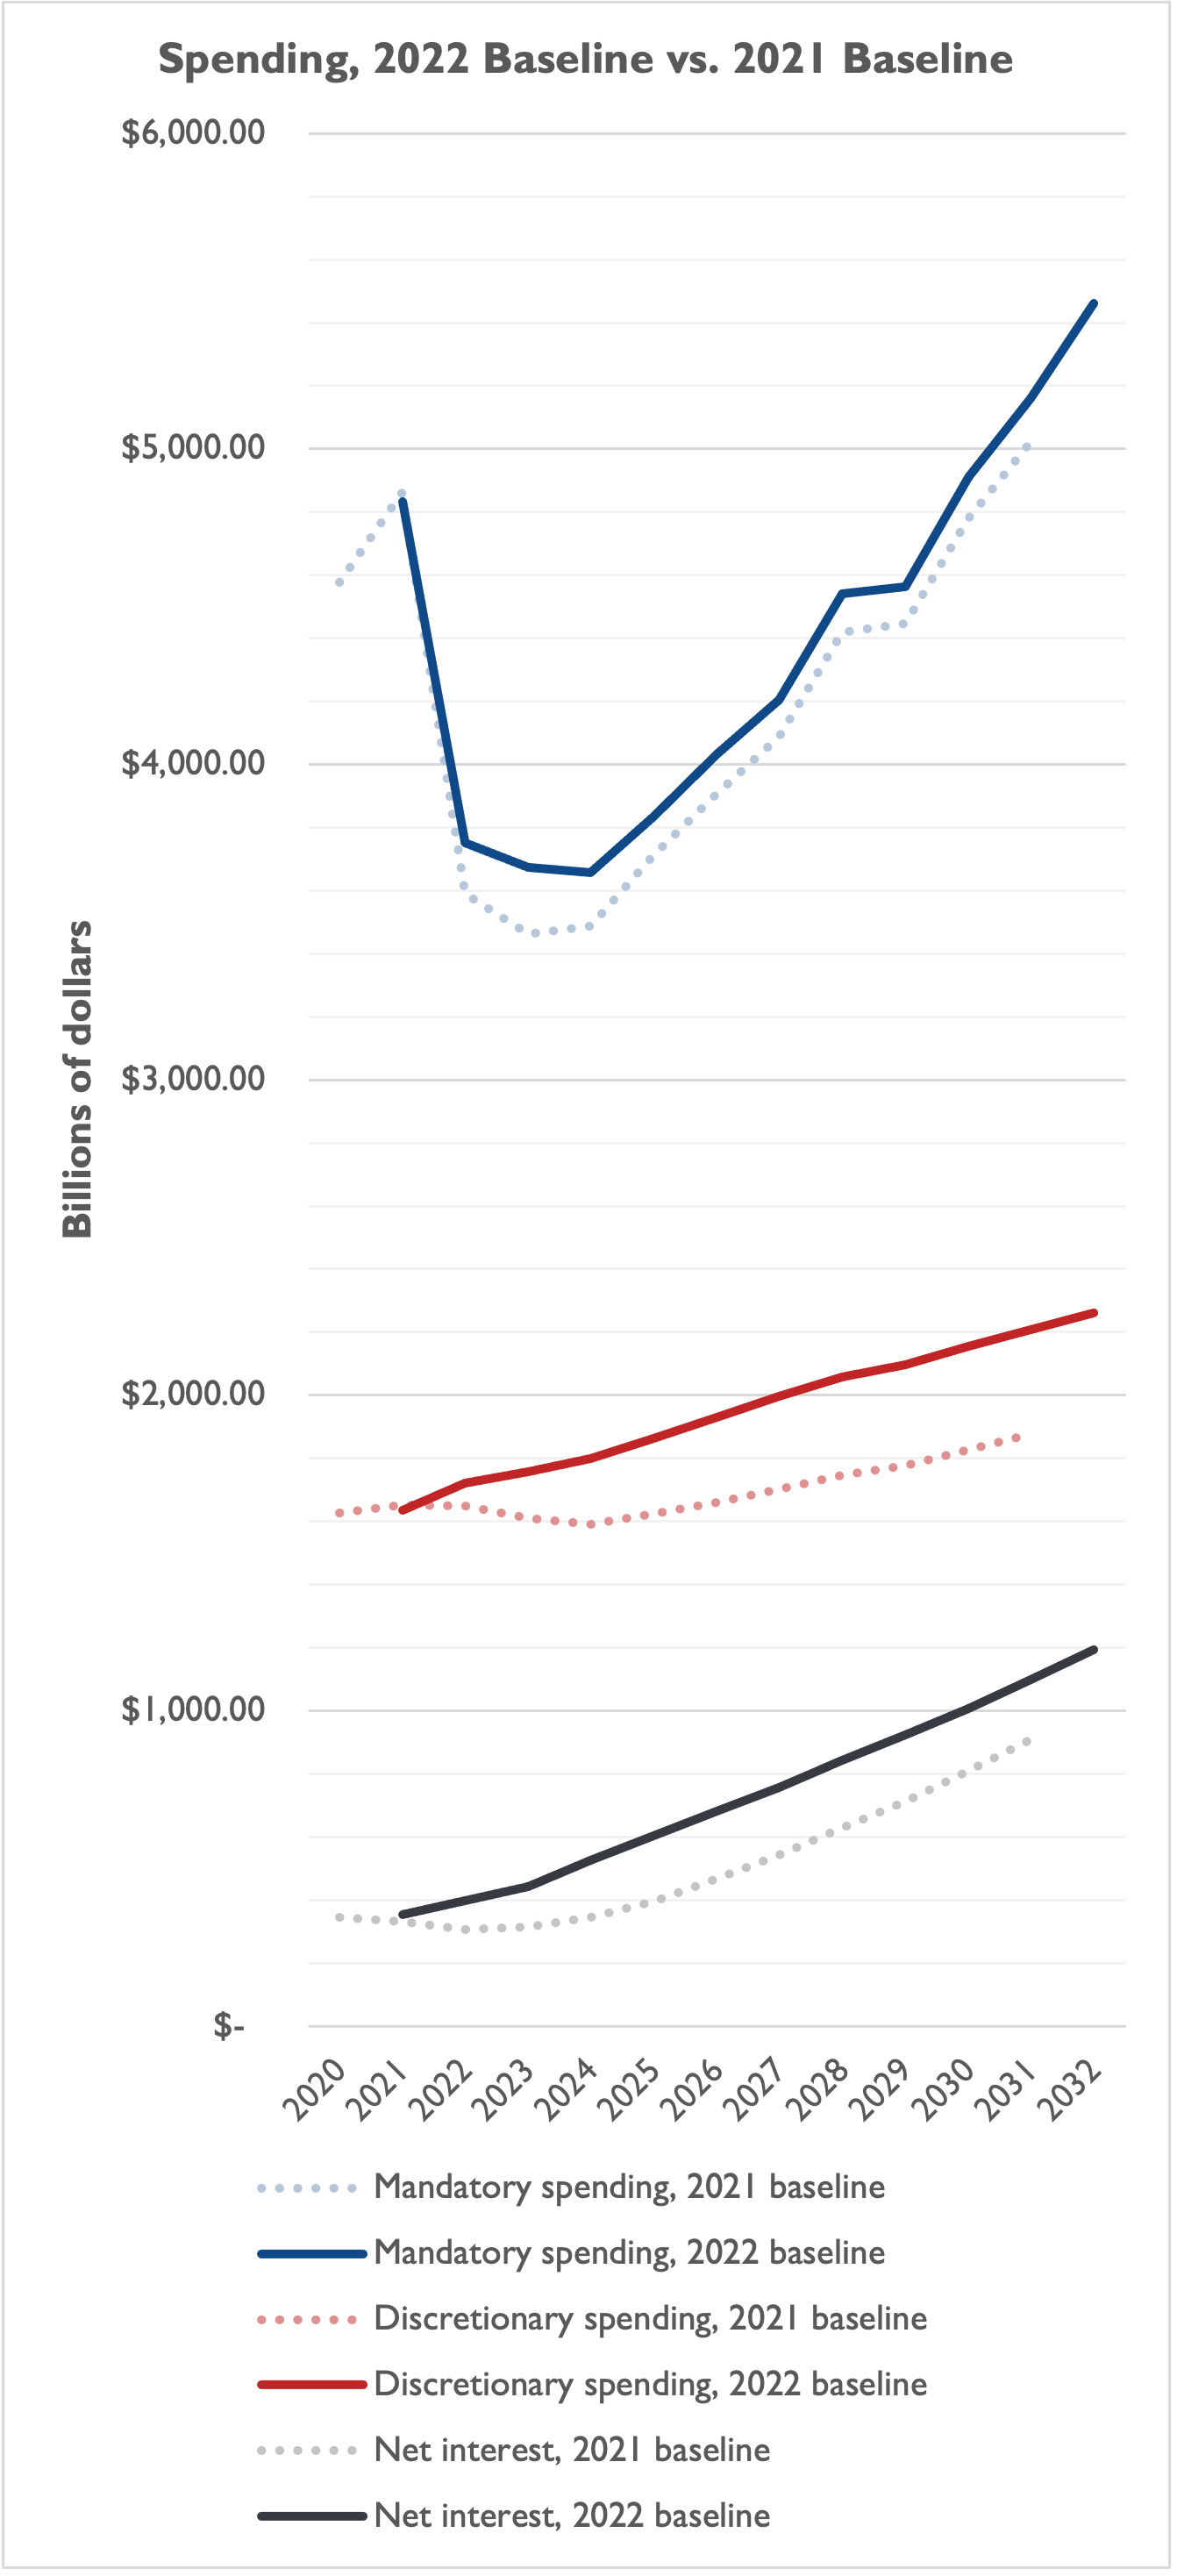
Unfortunately, spending accelerates at an even faster pace than revenue, and CBO projects that mandatory spending (e.g., Social Security, Medicare, and Medicaid), discretionary spending (e.g., much of defense, education, environmental, and foreign affairs spending), and net interest on the debt will all be higher relative to the July 2021 baseline. The total spending difference from FYs 2022-2031 is about $5.79 trillion, or an average of $579 billion per year. Breaking things down further:
- As a share of GDP, mandatory spending actually dips from 15.19 percent of GDP in FY 2022 to 13.40 percent of GDP in FY 2024, before rising to 14.62 percent of GDP in FY 2031;
- Discretionary spending falls from 6.97 percent of GDP in FY 2022 to 6.25 percent of GDP in FY 2031;
- Net interest on the debt nearly doubles, from 1.62 percent of GDP in FY 2022 to 3.11 percent of GDP in FY 2031; and
- Overall spending rises from FYs 2024-2031, after a brief dip over FY 2022 and FY 2023.
The Gap Between Government Spending and Tax Revenue Grows
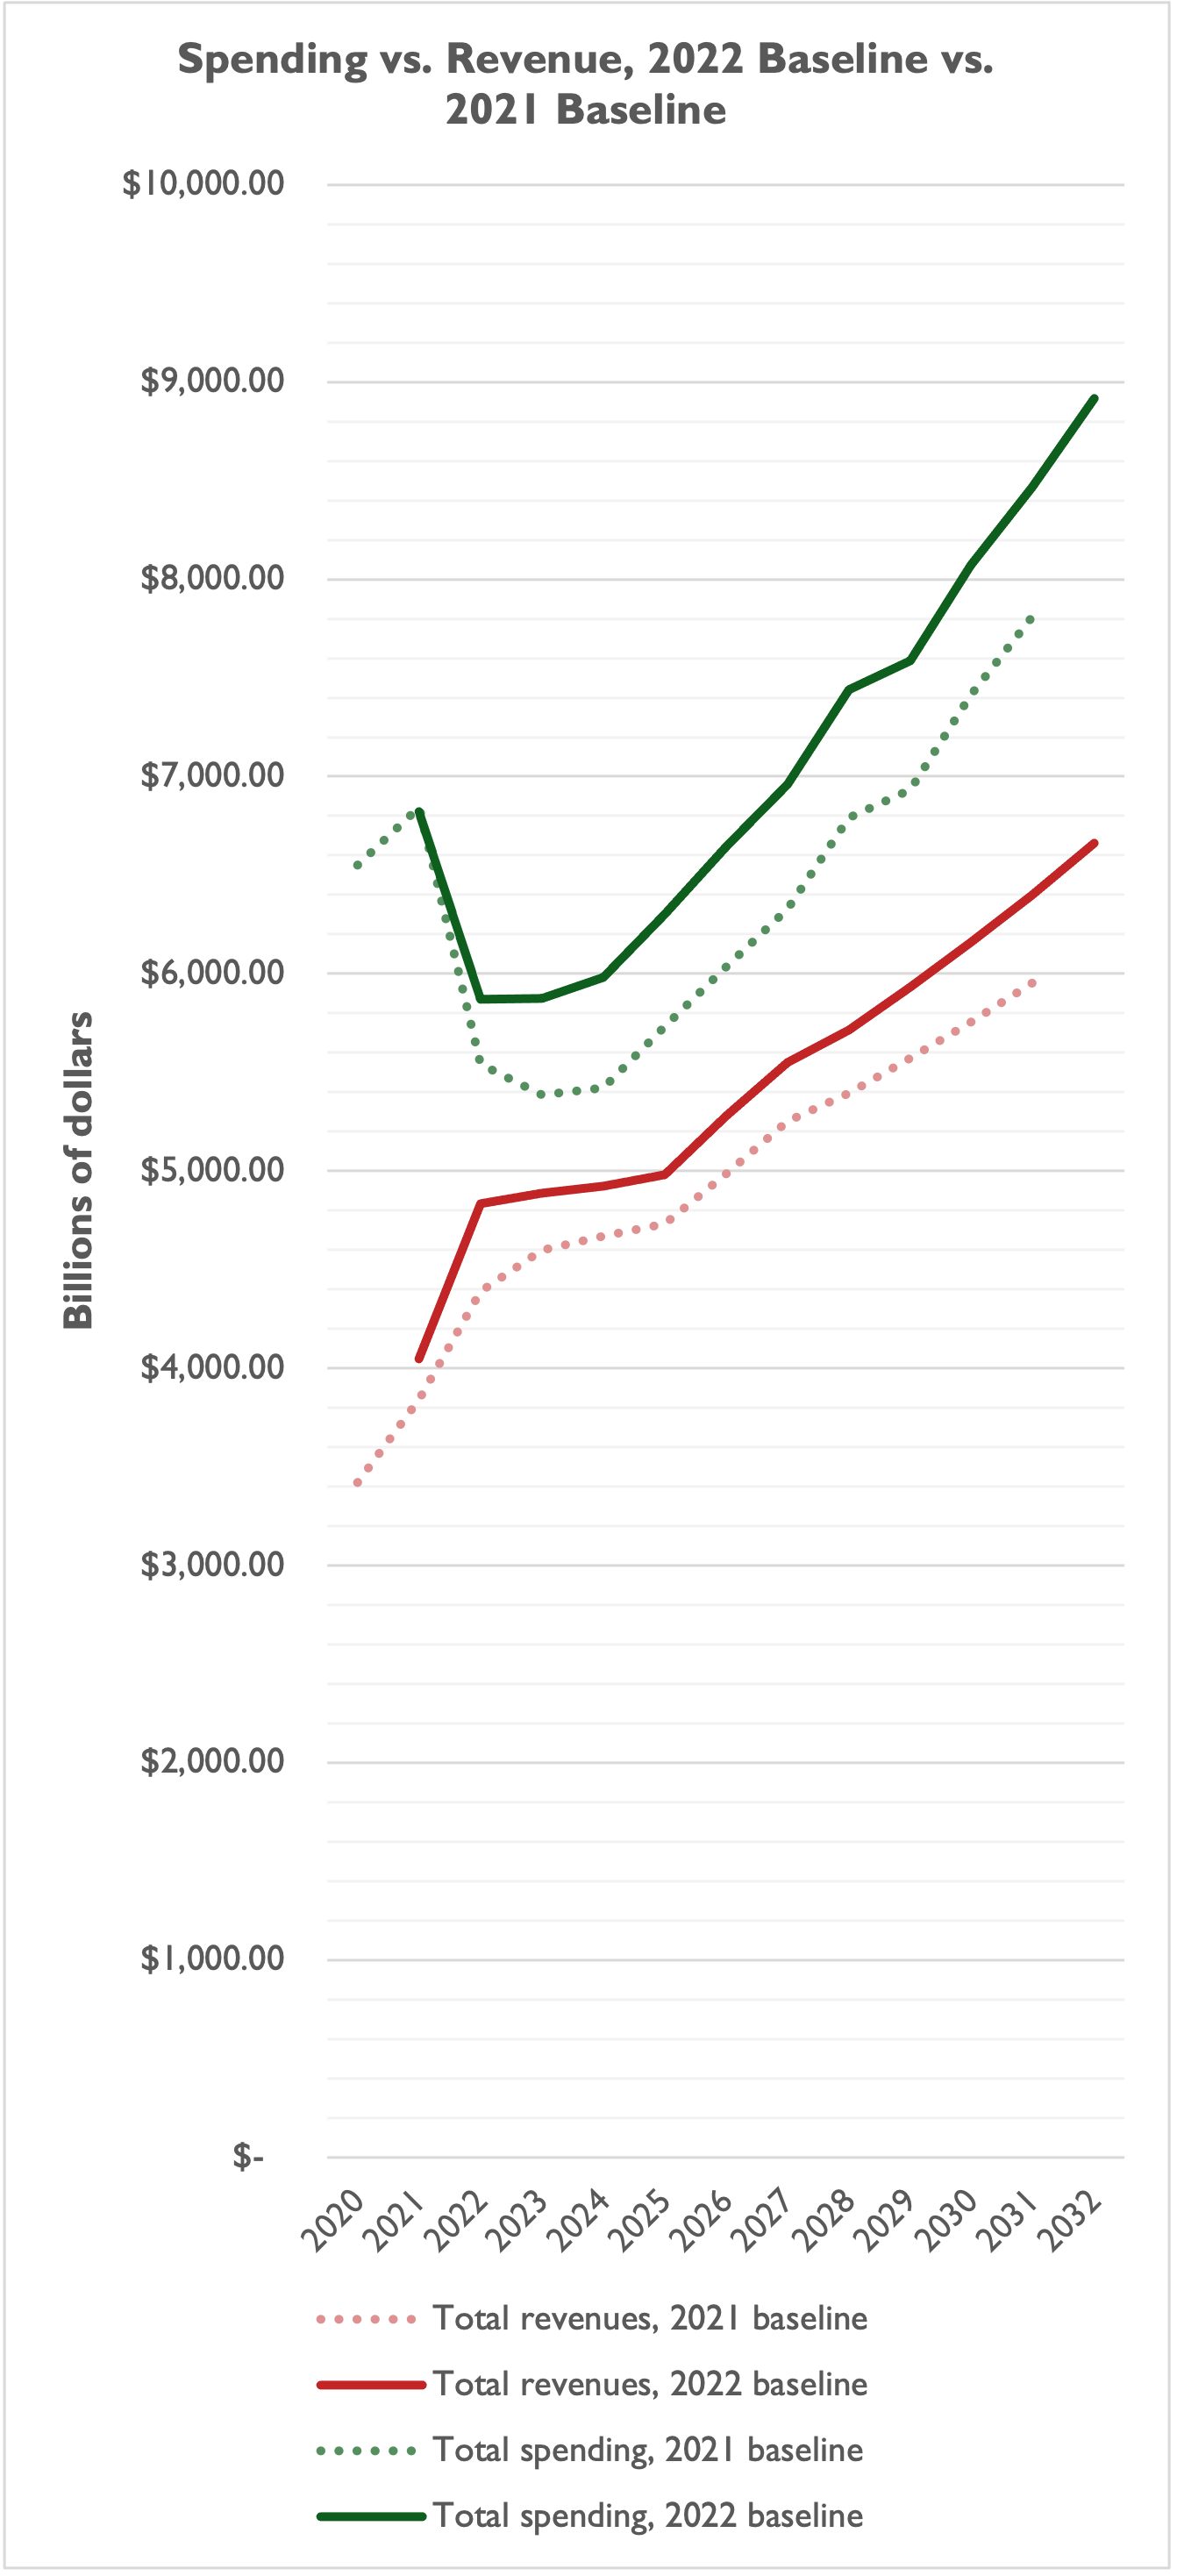
As a result of spending increasing relative to GDP, and revenue mostly holding steady, the gap between spending and revenue grows – both over the 10-year window projected by CBO and in comparison to the July 2021 baseline. As the graphic above shows, both revenue and spending are up relative to last year’s baseline, but spending is up more than revenue.
…So Deficits and Debt Rise
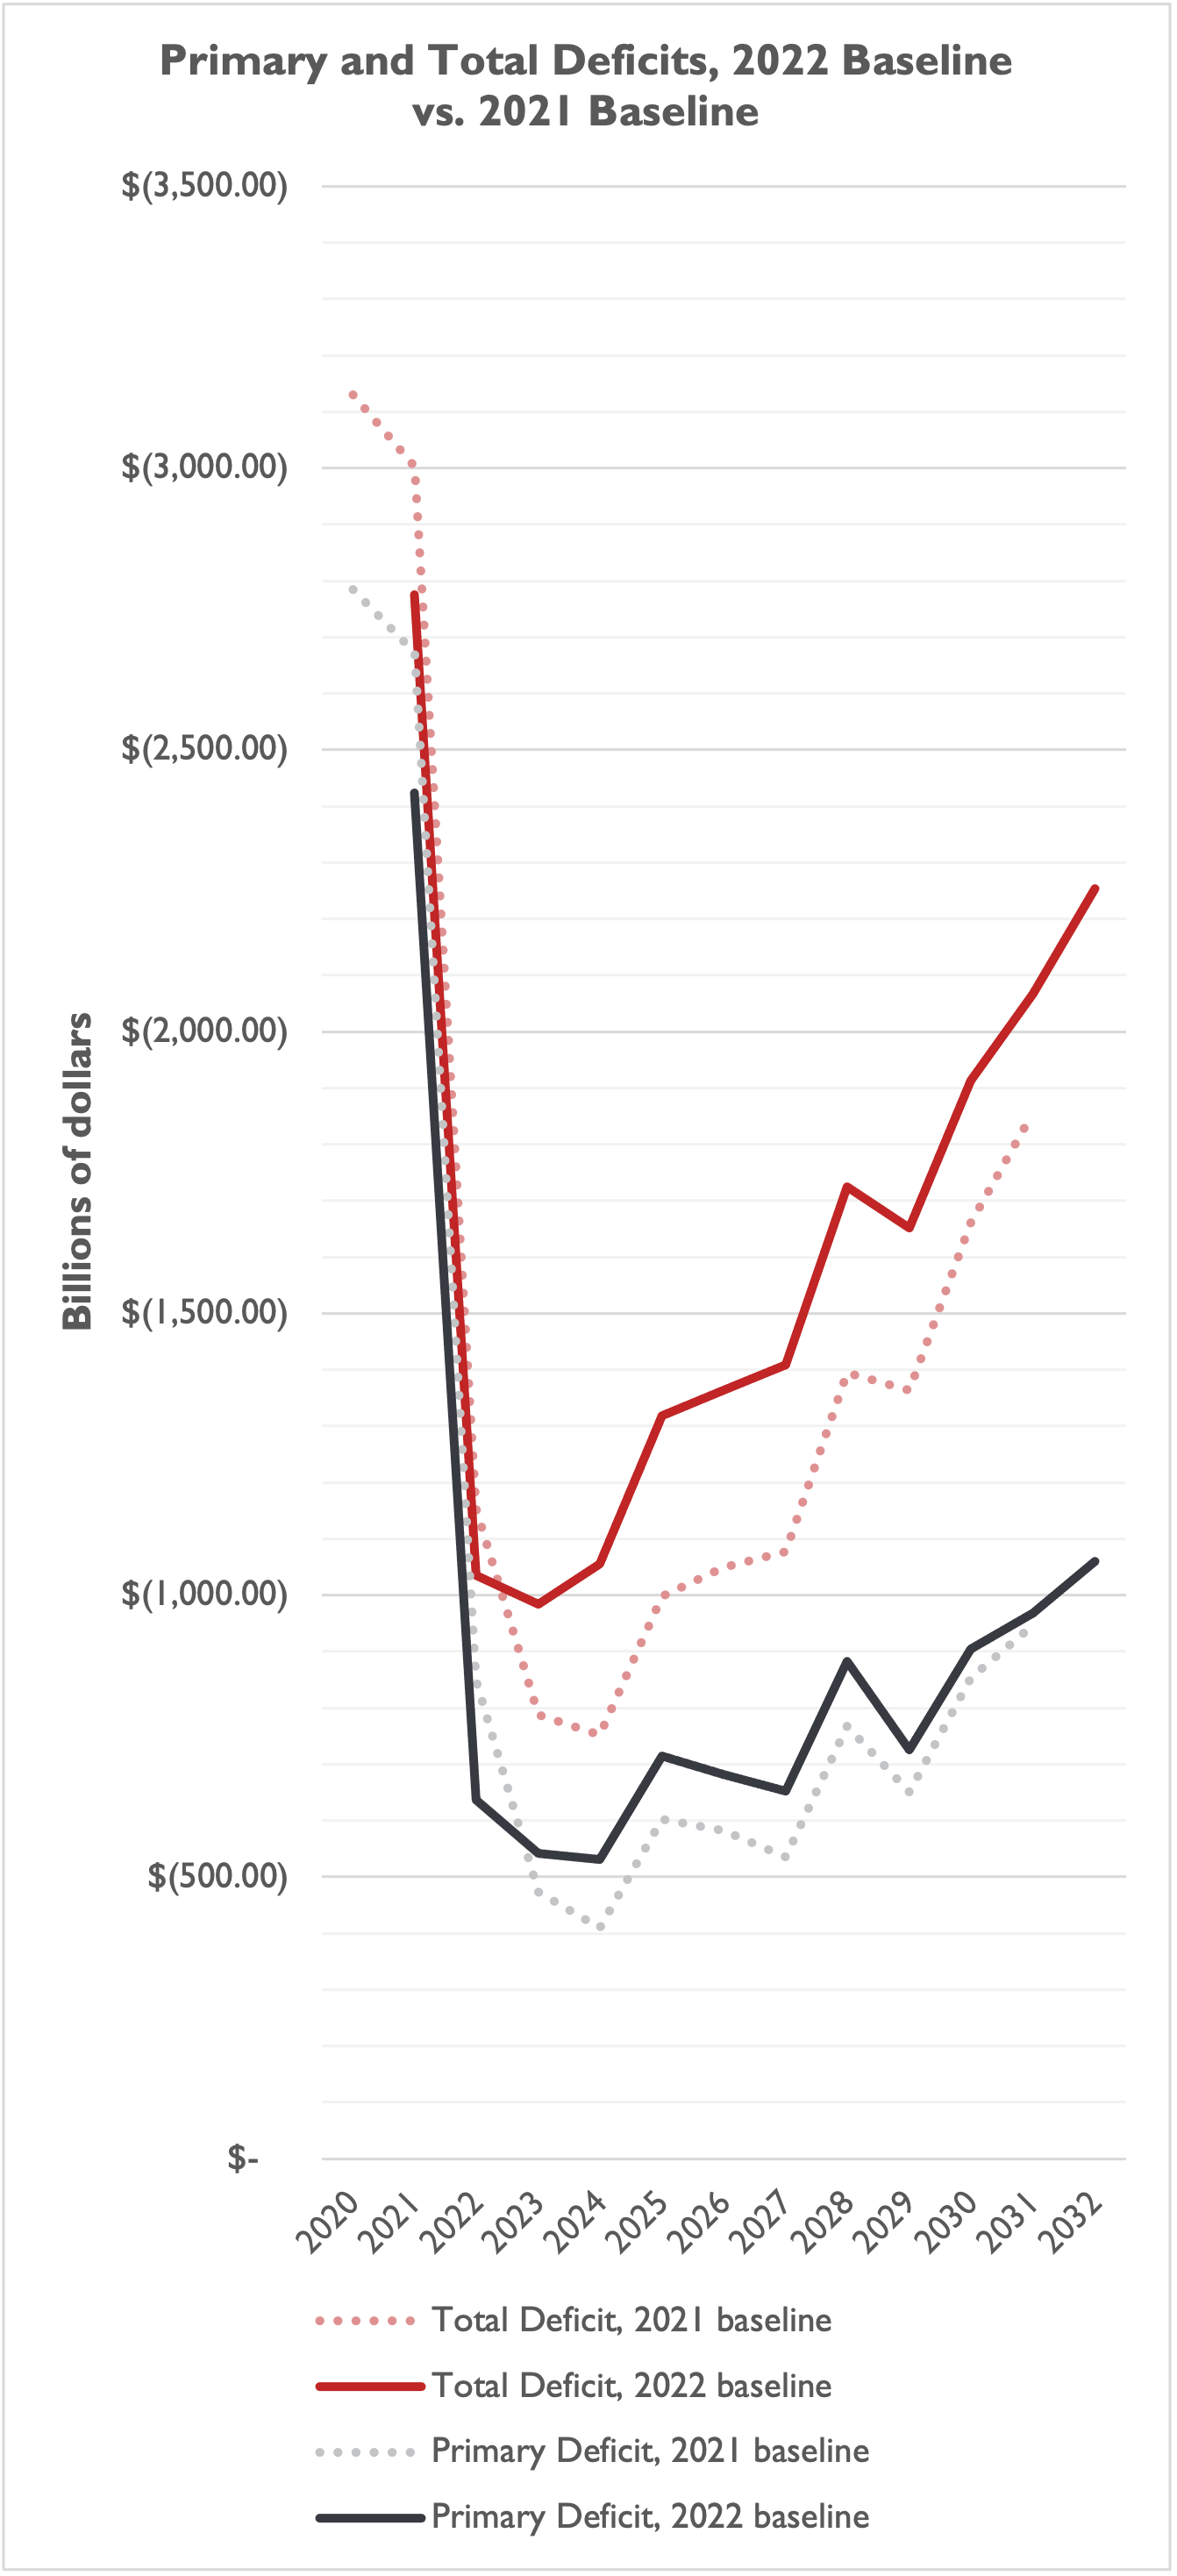
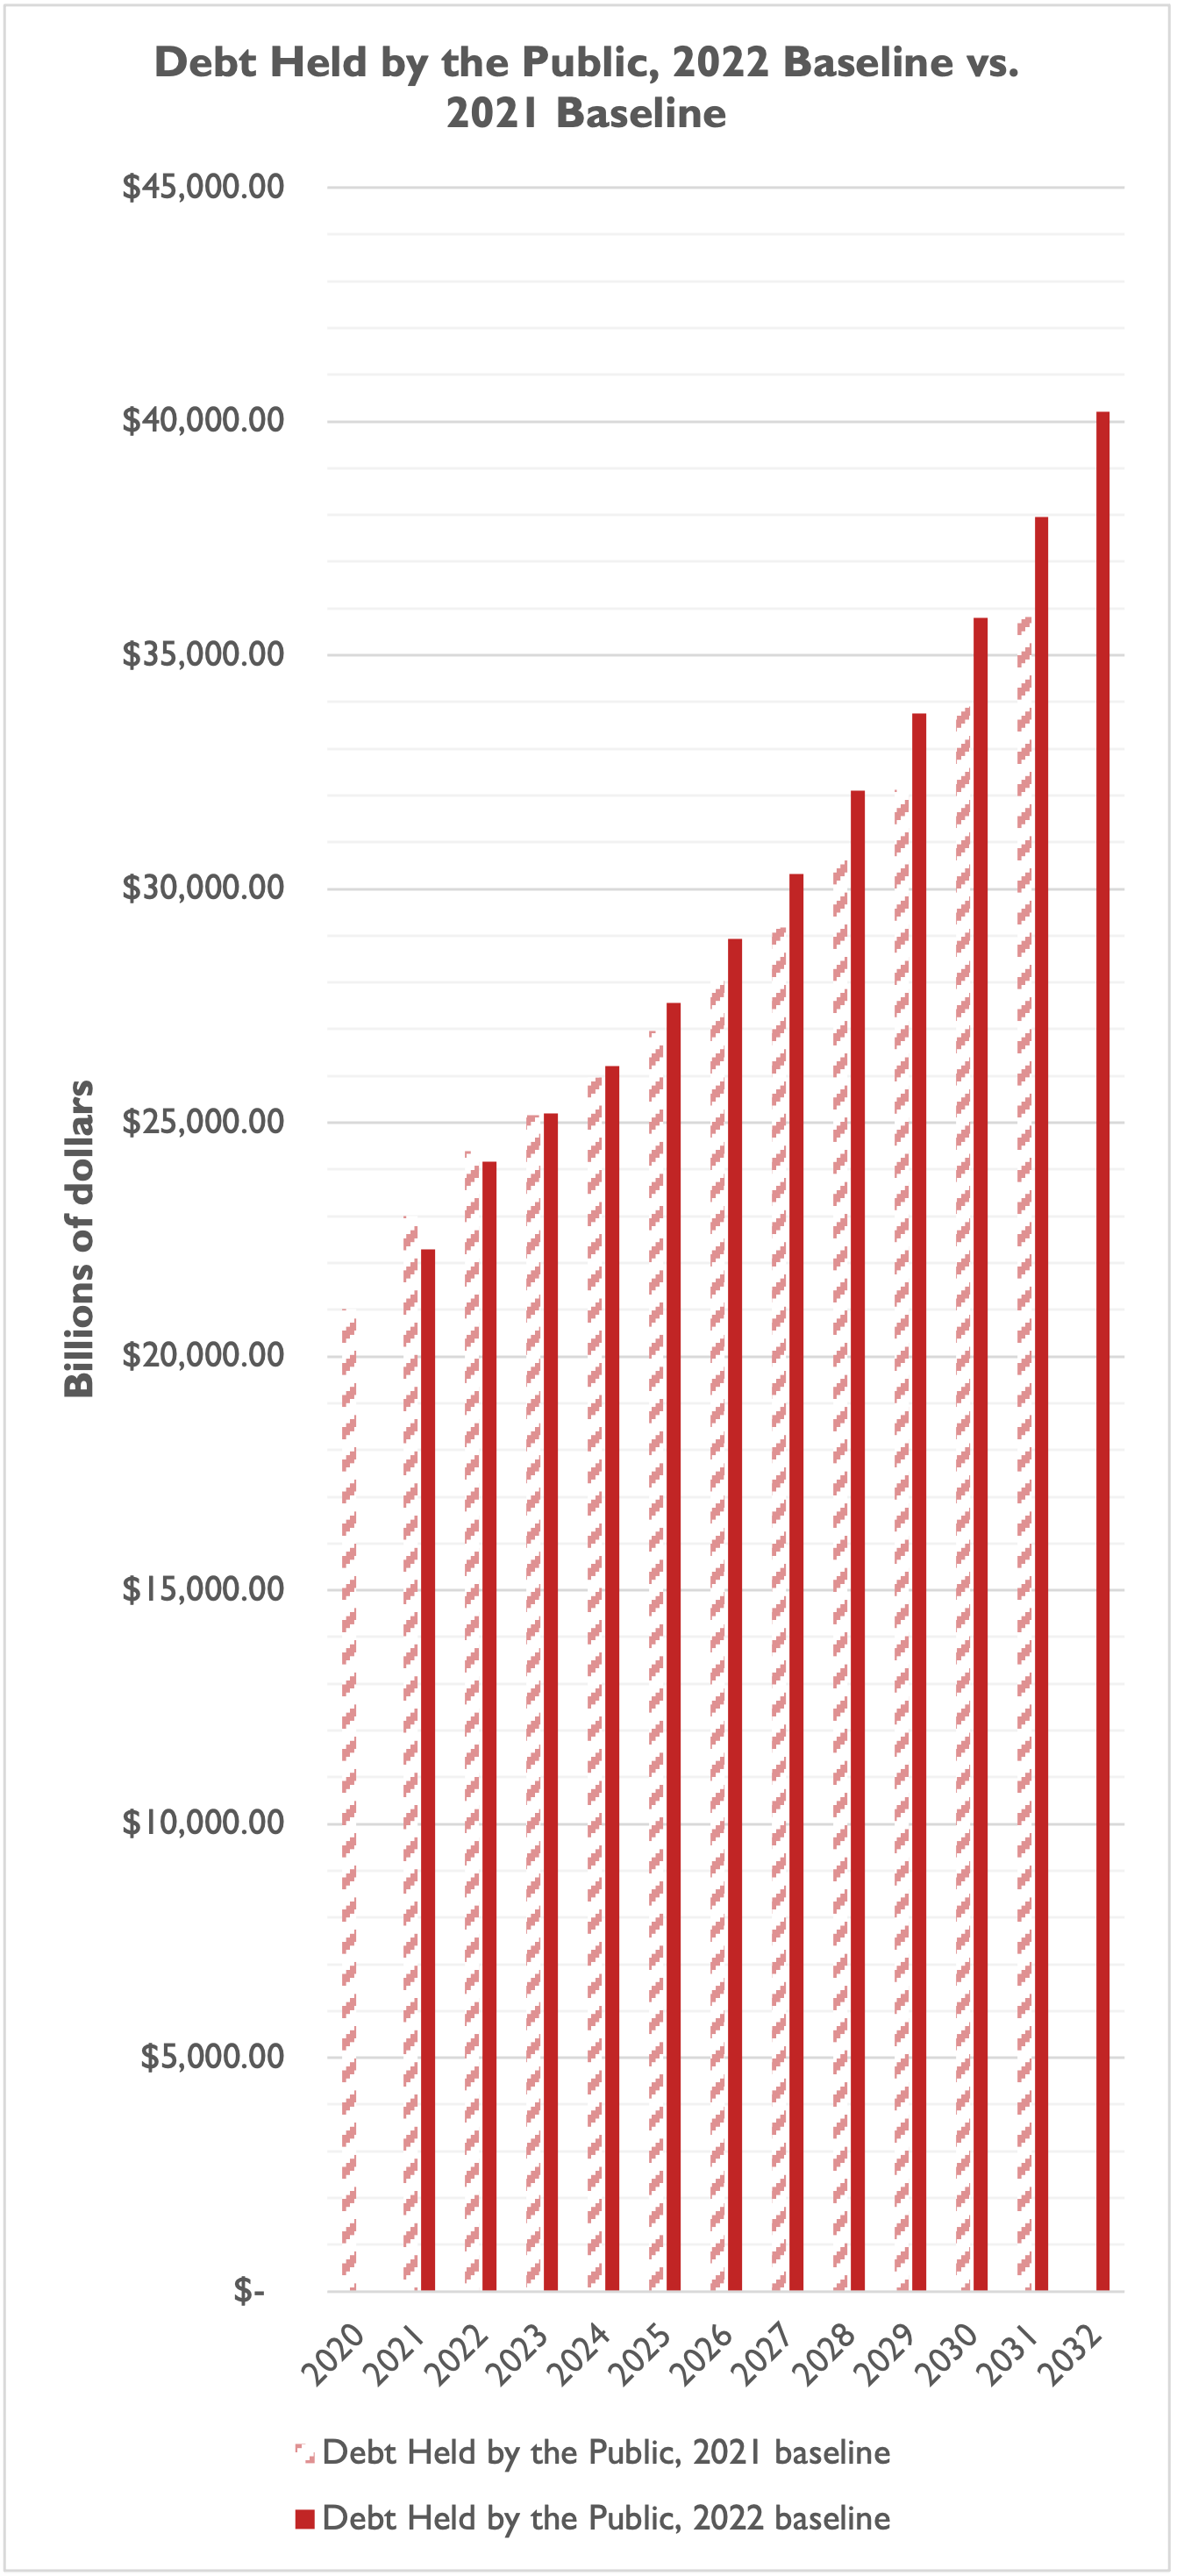
Due to that growing gap between federal spending and revenue, deficits are projected to grow relative to last year’s baseline. The total deficit will come down in FY 2022, relative to the pandemic spending years of FY 2020 and FY 2021 that drove historic deficits, but deficits still approach or exceed $1 trillion in each year of the FYs 2022-2031 window. CBO projects the deficit will reach an astounding $2 trillion in FY 2031. As a share of the nation’s economy, the deficit will decline from 4.19 of GDP in FY 2022 to 3.87 percent of GDP in FY 2024, before rising to 5.85 percent of GDP in FY 2031.
All the while, debt held by the public (which excludes intragovernmental holdings, or debt the government owes itself, currently around $6.6 trillion) will rise from $24.17 trillion in FY 2022 to $37.95 trillion in FY 2031, and then an eye-popping $40.21 trillion in FY 2032. As a share of the economy, debt is 97.89 percent of GDP in FY 2022 and 107.45 percent in FY 2031.
Social Security, Medicare, and Medicaid Drive Mandatory Spending Higher
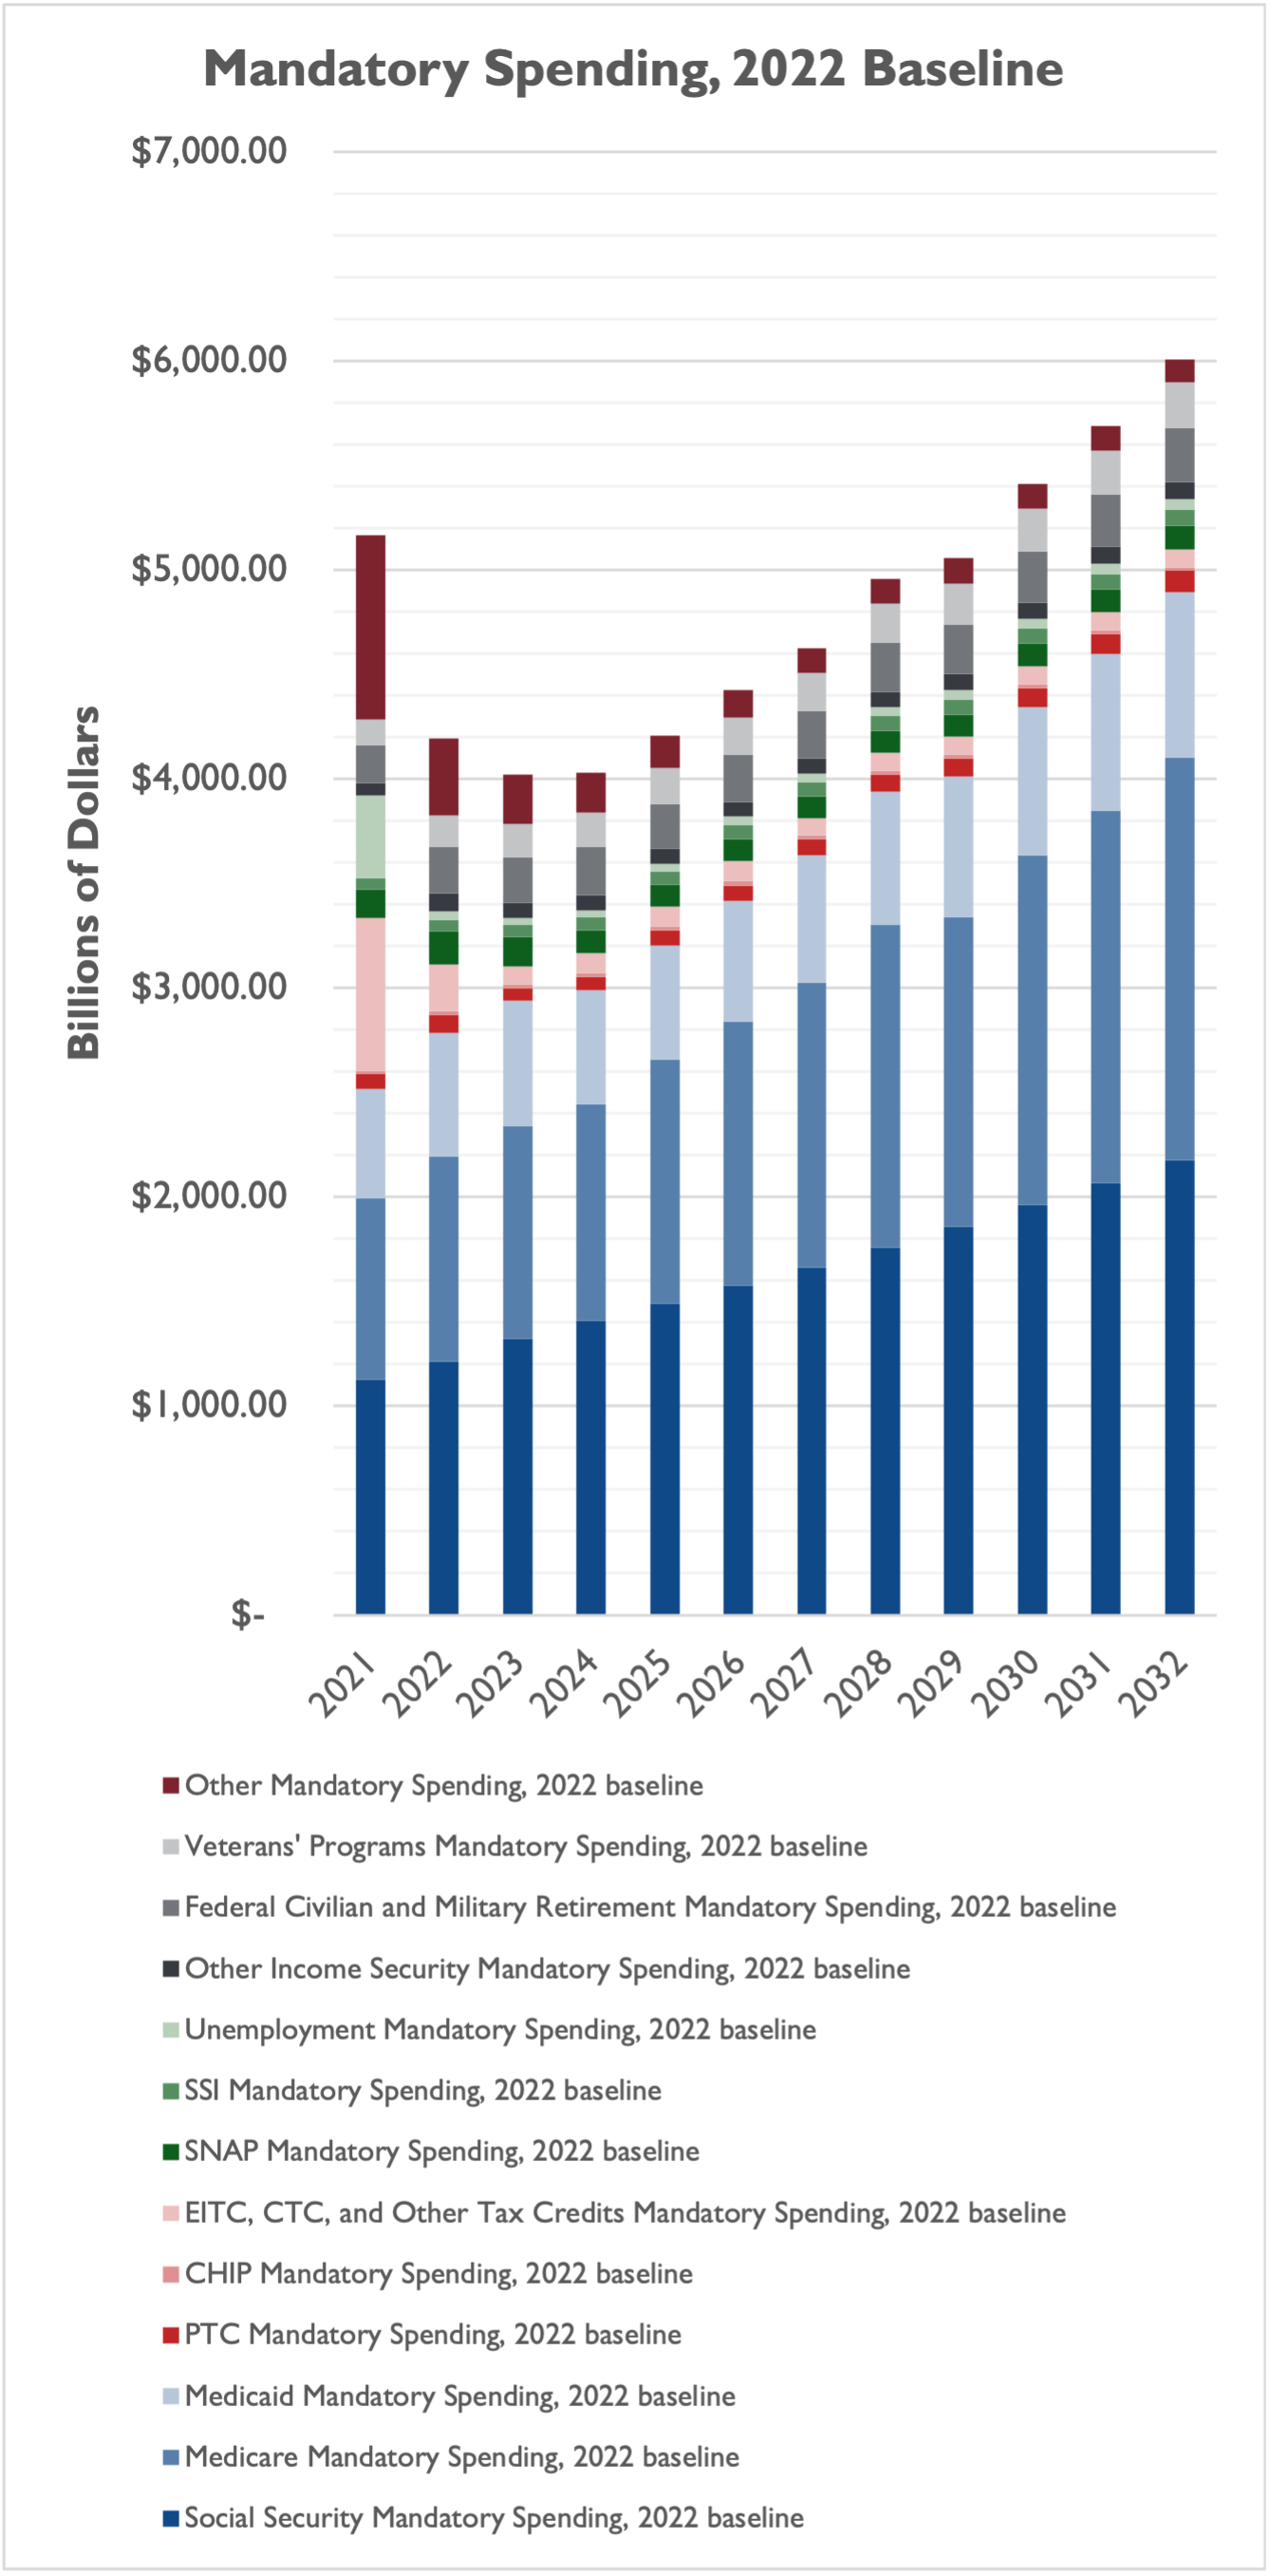
For the vast majority of government spending that’s on autopilot (70.67 percent in FY 2022, inclusive of net interest, and 73.92 percent by FY 2031), major drivers of increased spending are Social Security, Medicare and Medicaid. Federal civilian and military retirement spending generally increases over the decade, as does spending on veterans programs. Spending on unemployment insurance, family support tax credits (e.g., Earned Income Tax Credit and the Child Tax Credit), and “other” mandatory programs fall from their highs of FY 2021, as pandemic spending winds down.
…but Discretionary Spending Goes Up Too
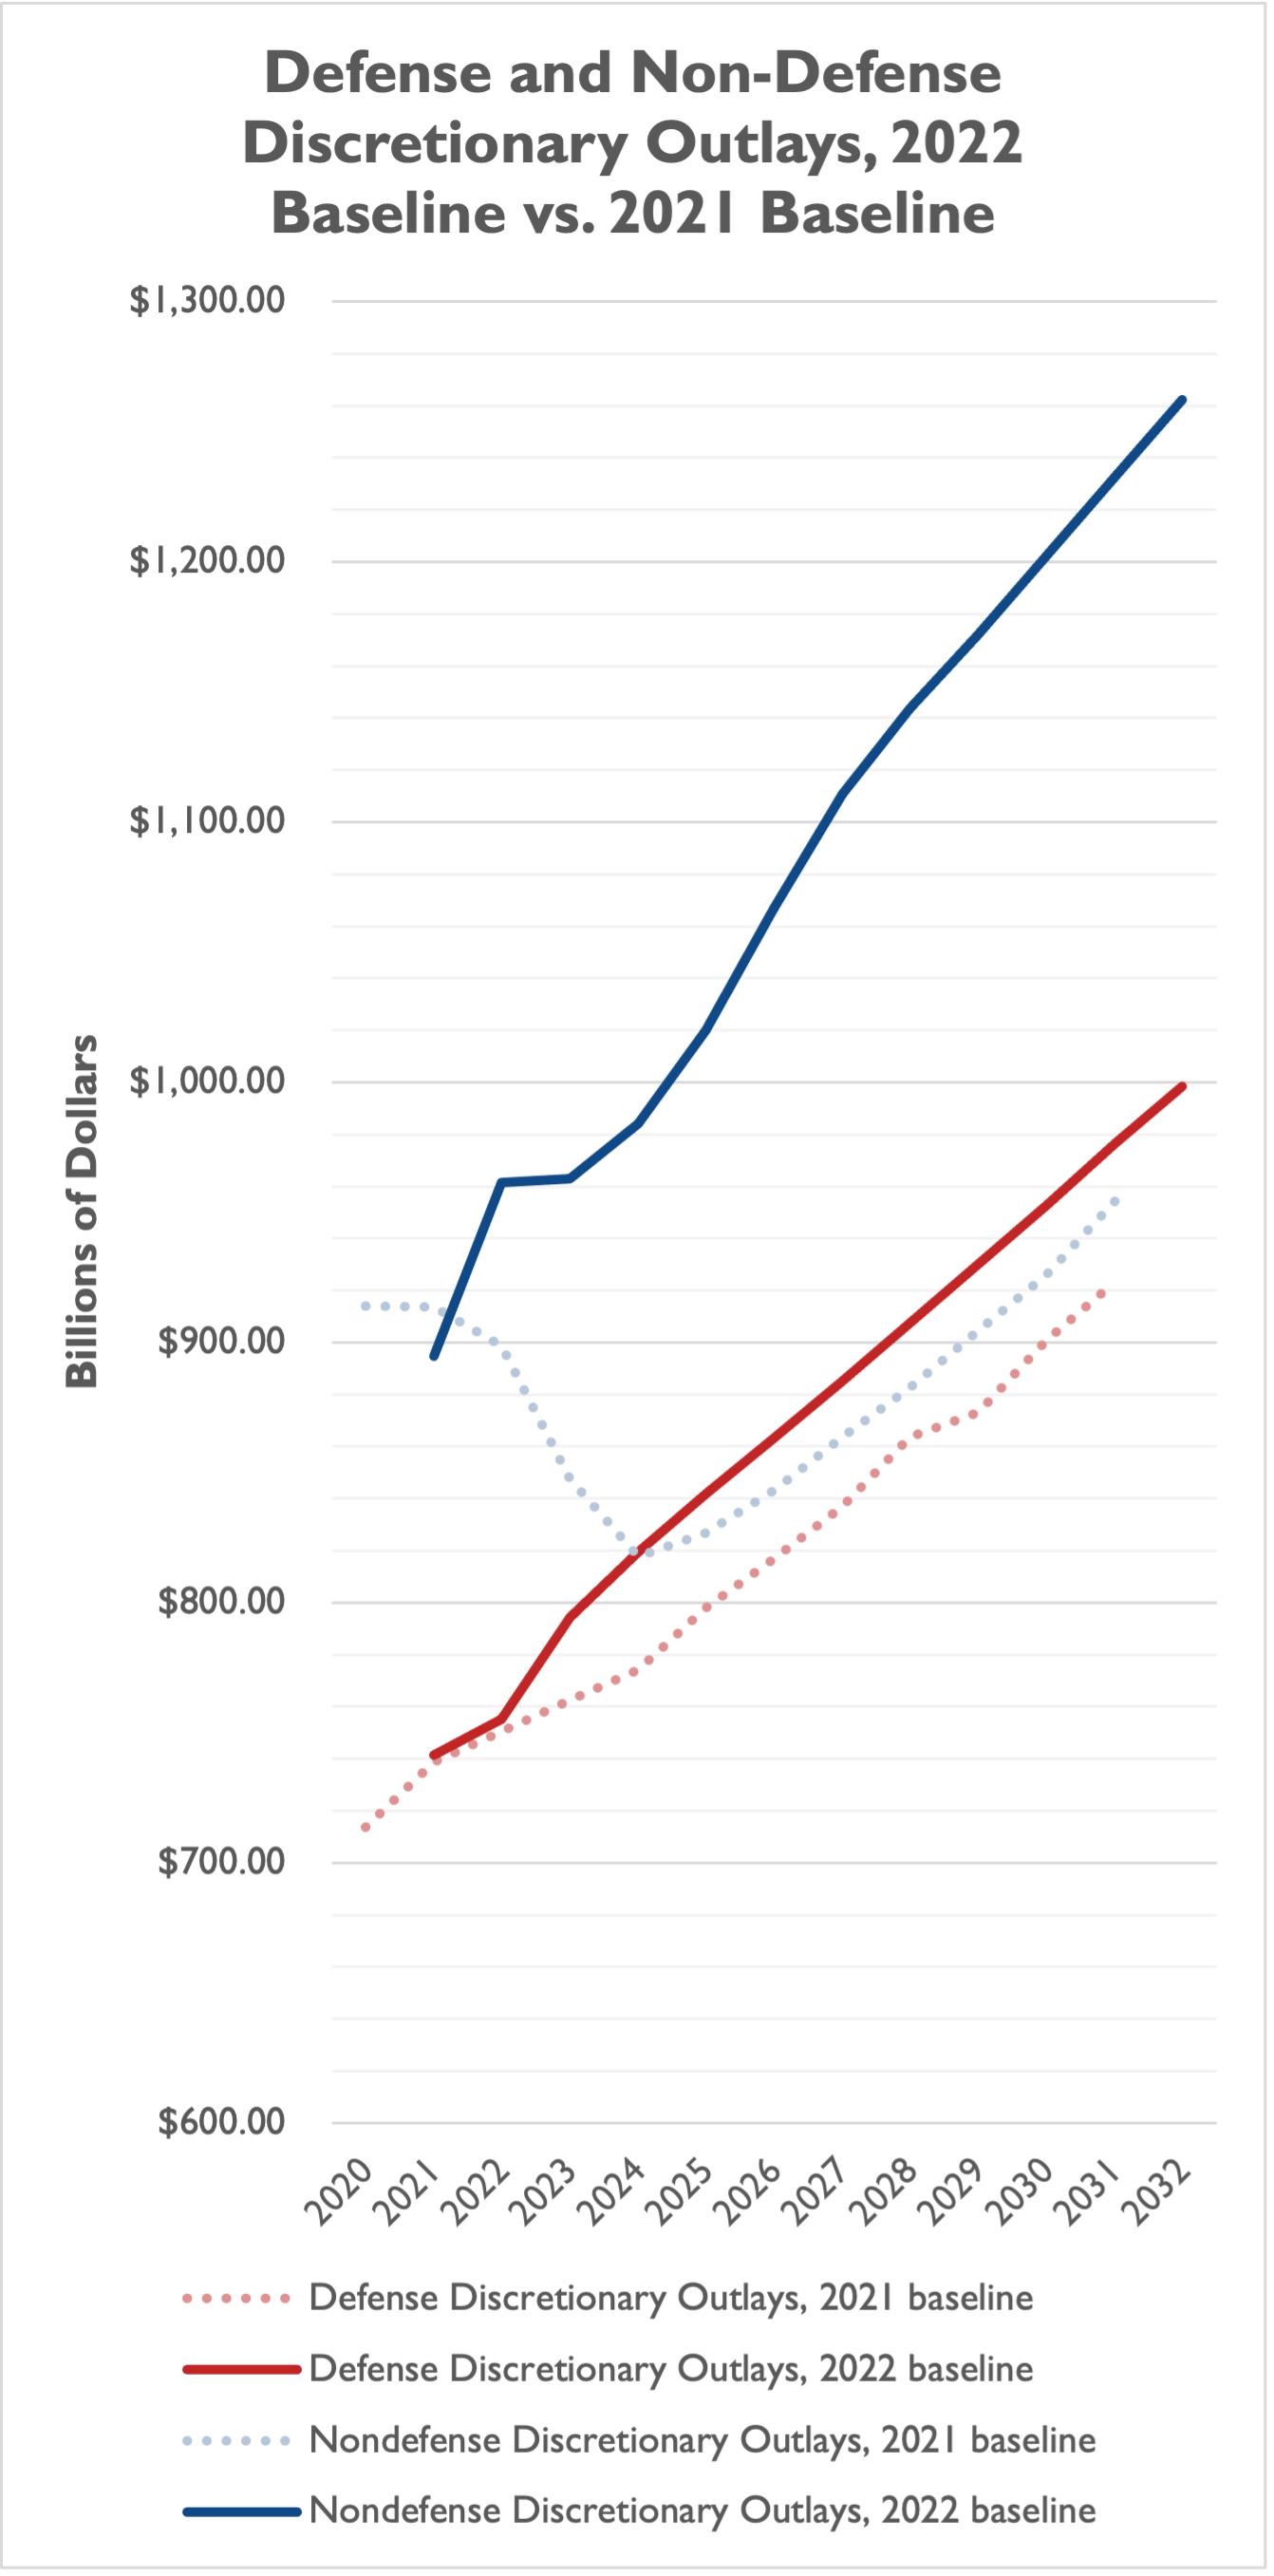
Increases in mandatory spending are not the only pressure point for federal spending, though. CBO’s updated baseline projects higher discretionary spending on both the defense and non-defense sides of the ledger relative to the July 2021 baseline. Defense outlays are projected to be $426 billion higher from FYs 2022-2031, compared to last year’s baseline, while non-defense outlays are projected to be $2.09 trillion higher over the decade. Major drivers likely include lawmakers’ successful efforts to increase the defense budget topline, relative to what President Biden proposed in his FY 2022 budget, and the infrastructure law that Congress passed and the President signed last fall. As a percent of GDP, defense outlays fall from 3.06 percent in FY 2022 to 2.76 percent in FY 2031, while non-defense outlays fall from 3.89 percent of GDP in FY 2022 to 3.49 percent in FY 2031.
…with Operations and Personnel Driving Defense Increases
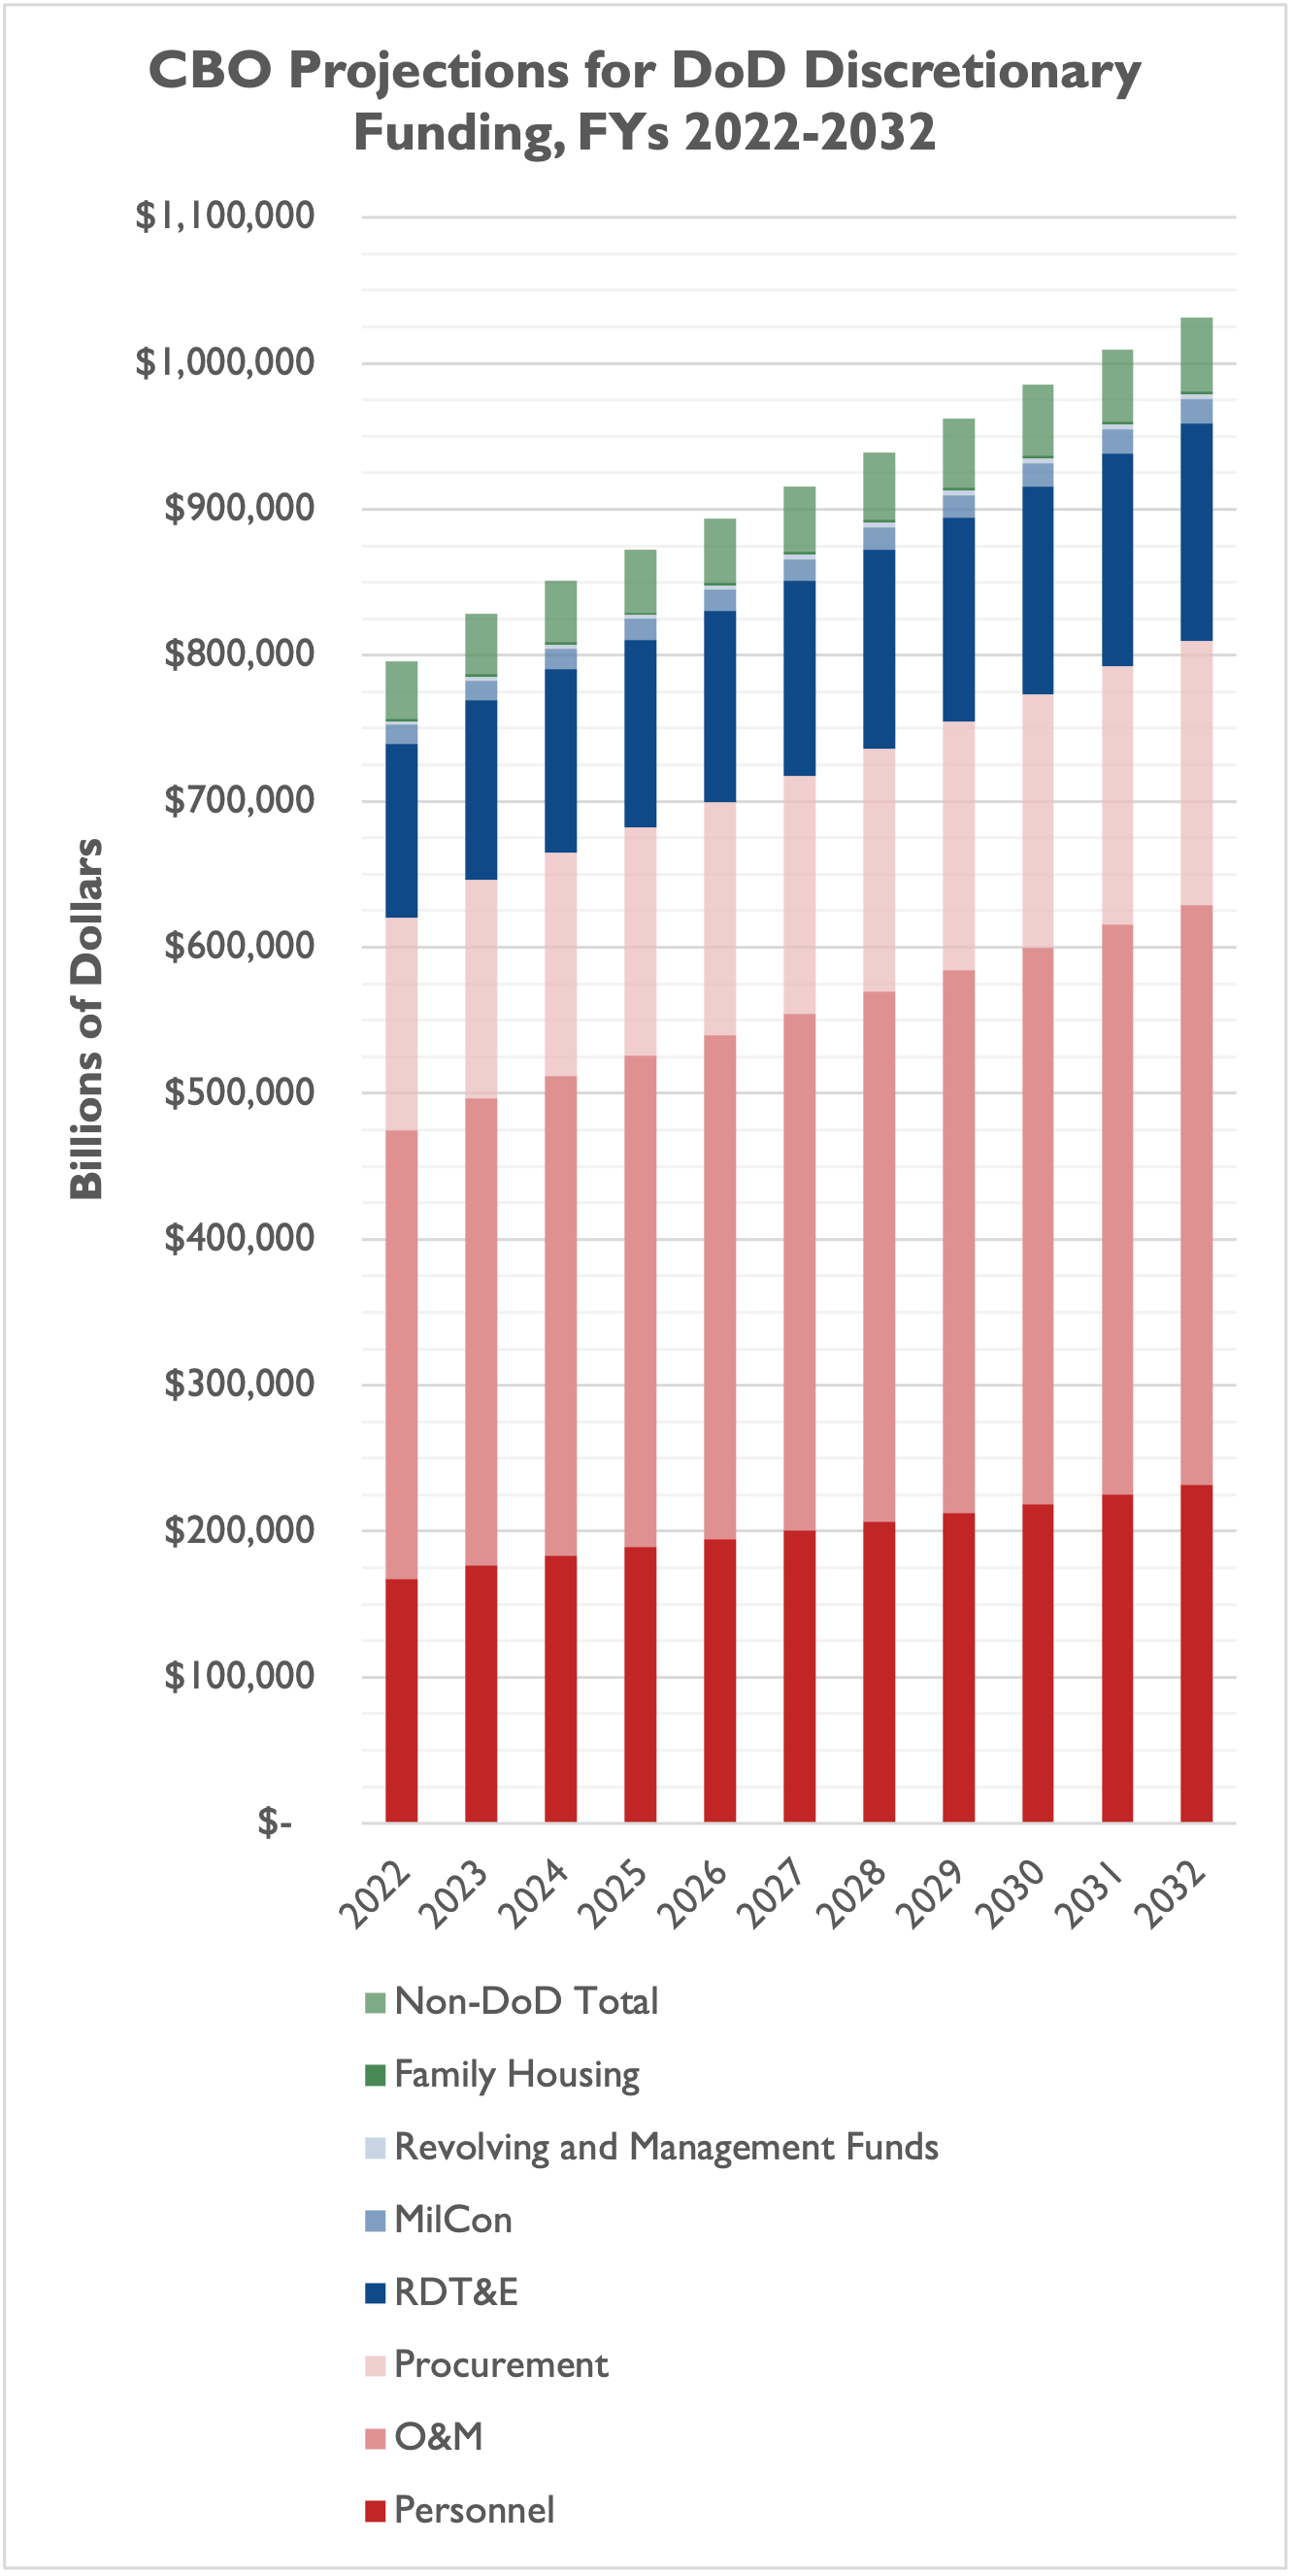
The defense topline – mostly Department of Defense budget authority, with national defense budget authority outside of DoD making up a small portion of the total – rises from $796 billion in FY 2022 to just over $1 trillion in FY 2031. Costs for military personnel and military operations drive spending higher, while procurement costs and research (RDT&E) see increases too. As a share of the economy, defense budget authority is actually projected to decline from FY 2022 through FY 2031, from 3.22 percent in FY 2022 to 2.86 percent in FY 2031.
The Future for Government Spending Looks Bleak, and for the Debt Even Bleaker
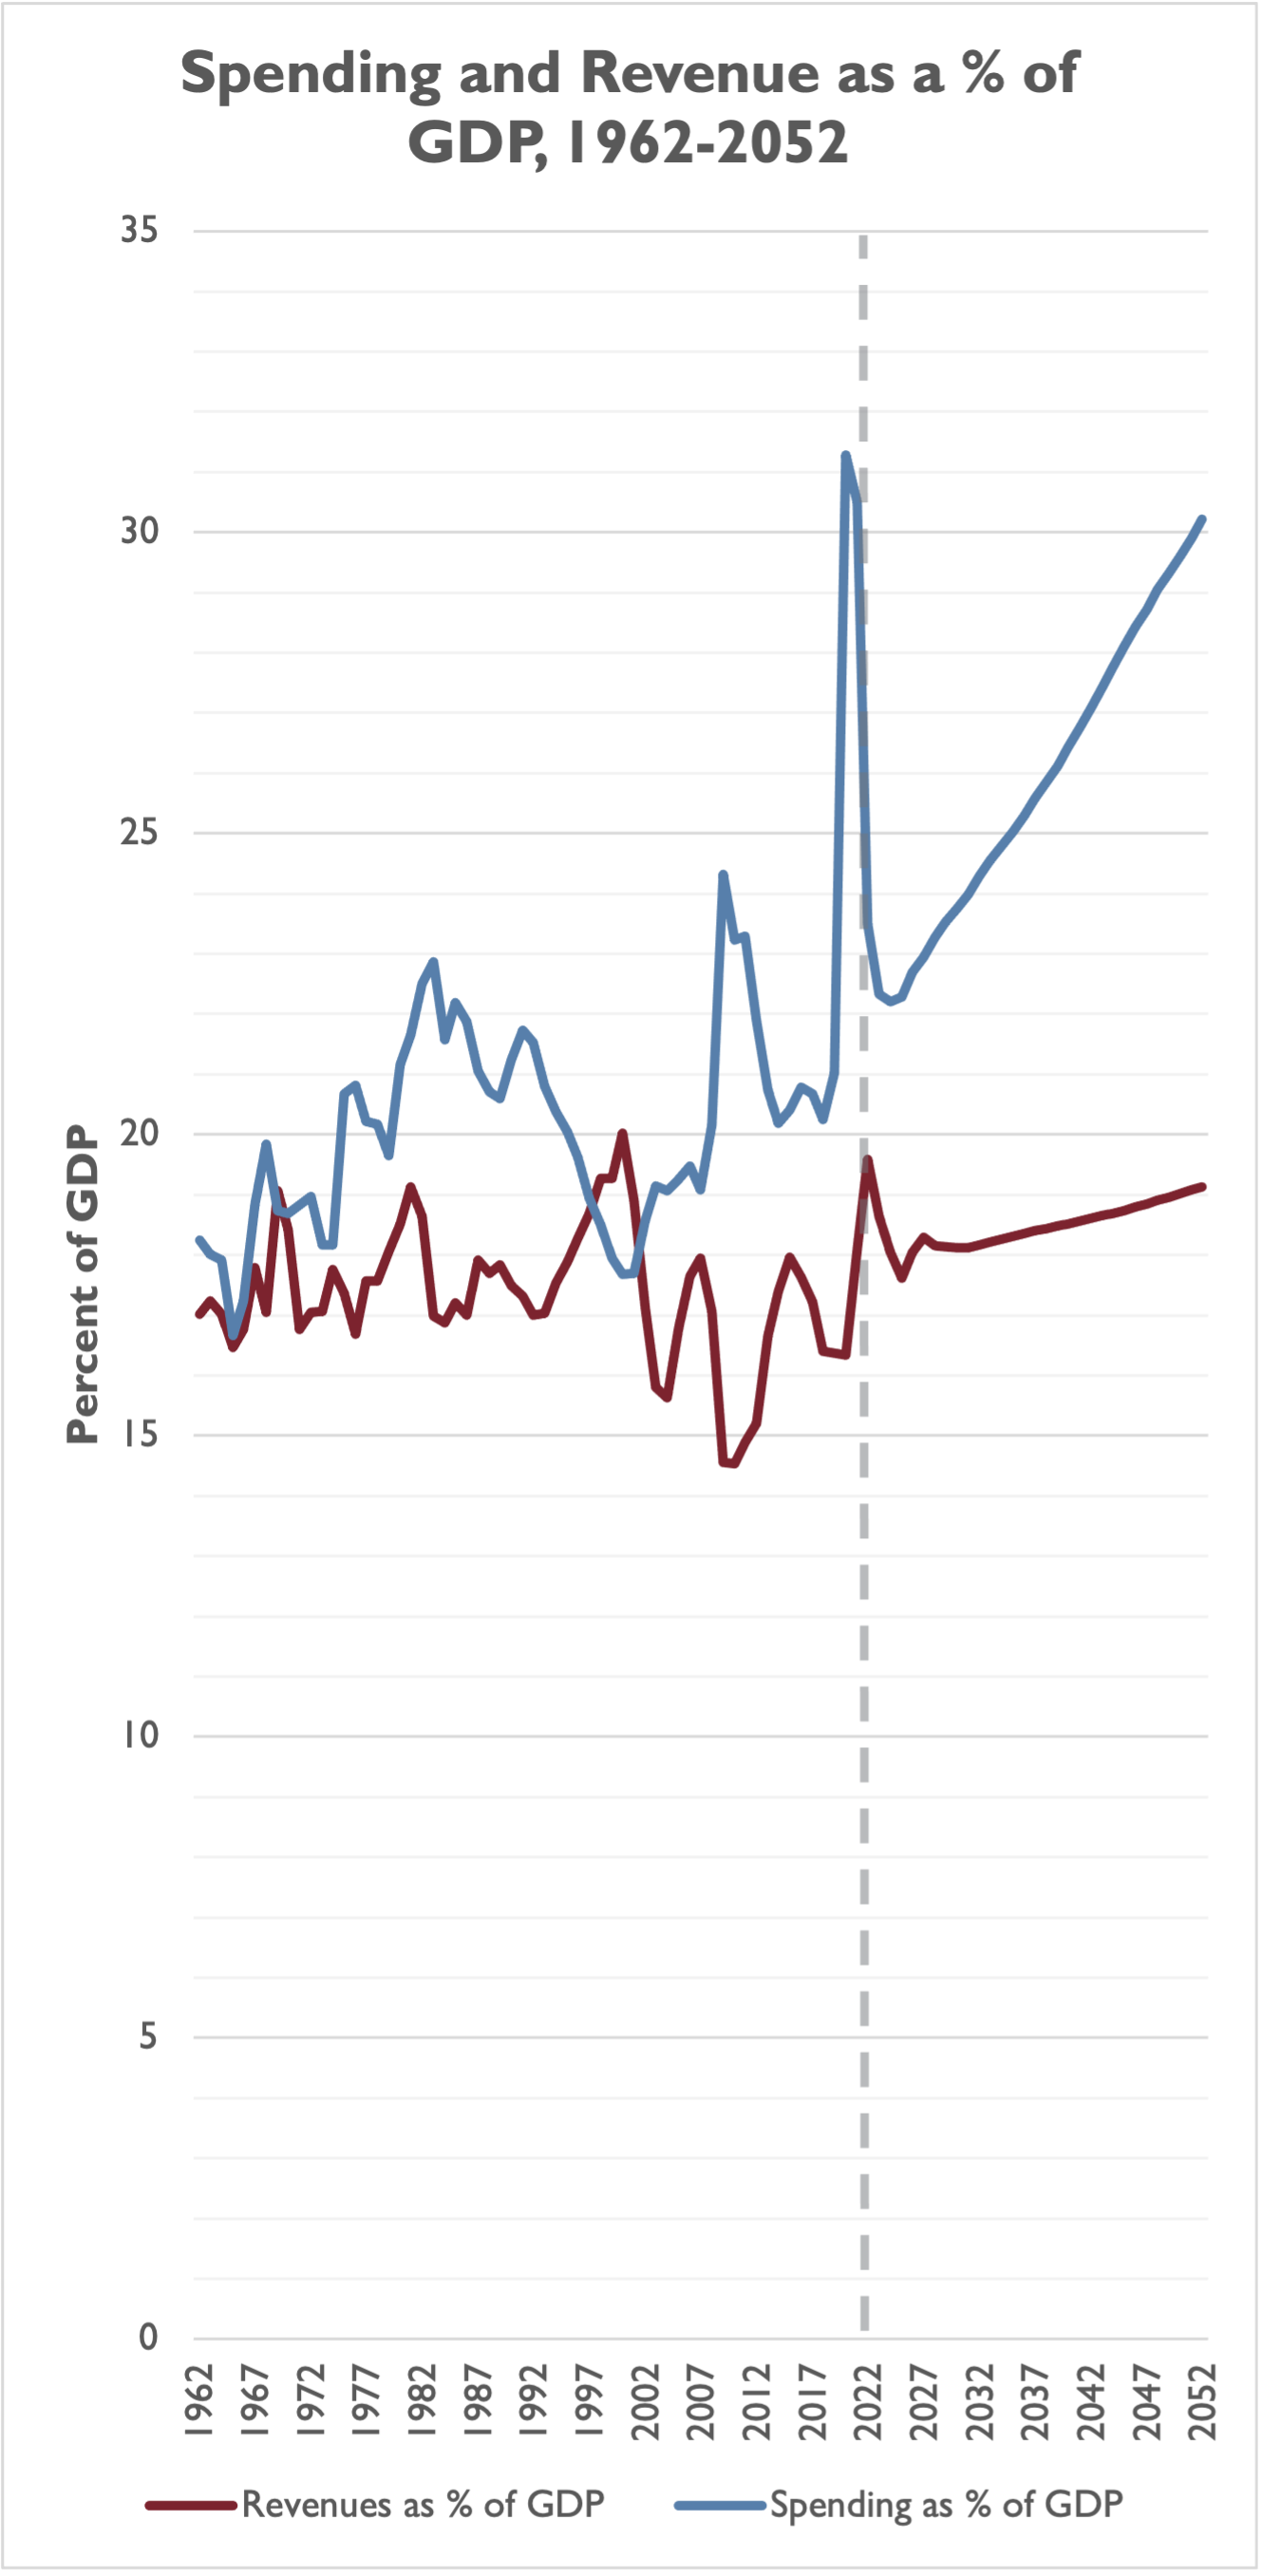

Zooming out and covering a 91-year period from 1962 through 2052, government spending as a percentage of GDP accelerates to non-pandemic historic levels well into the future. (The gray dotted line in each chart represents the current year; everything to the right of the current year is a CBO projection.) Revenue accelerates as a percentage of GDP, but not nearly enough to keep up with spending.
As a result, America’s federal debt (held by the public) zooms up like a rocket ship, surpassing 100 percent of GDP in FY 2028 and surpassing 180 percent of GDP in FY 2051.
…while the U.S. Economic Picture is Not Quite as Bleak
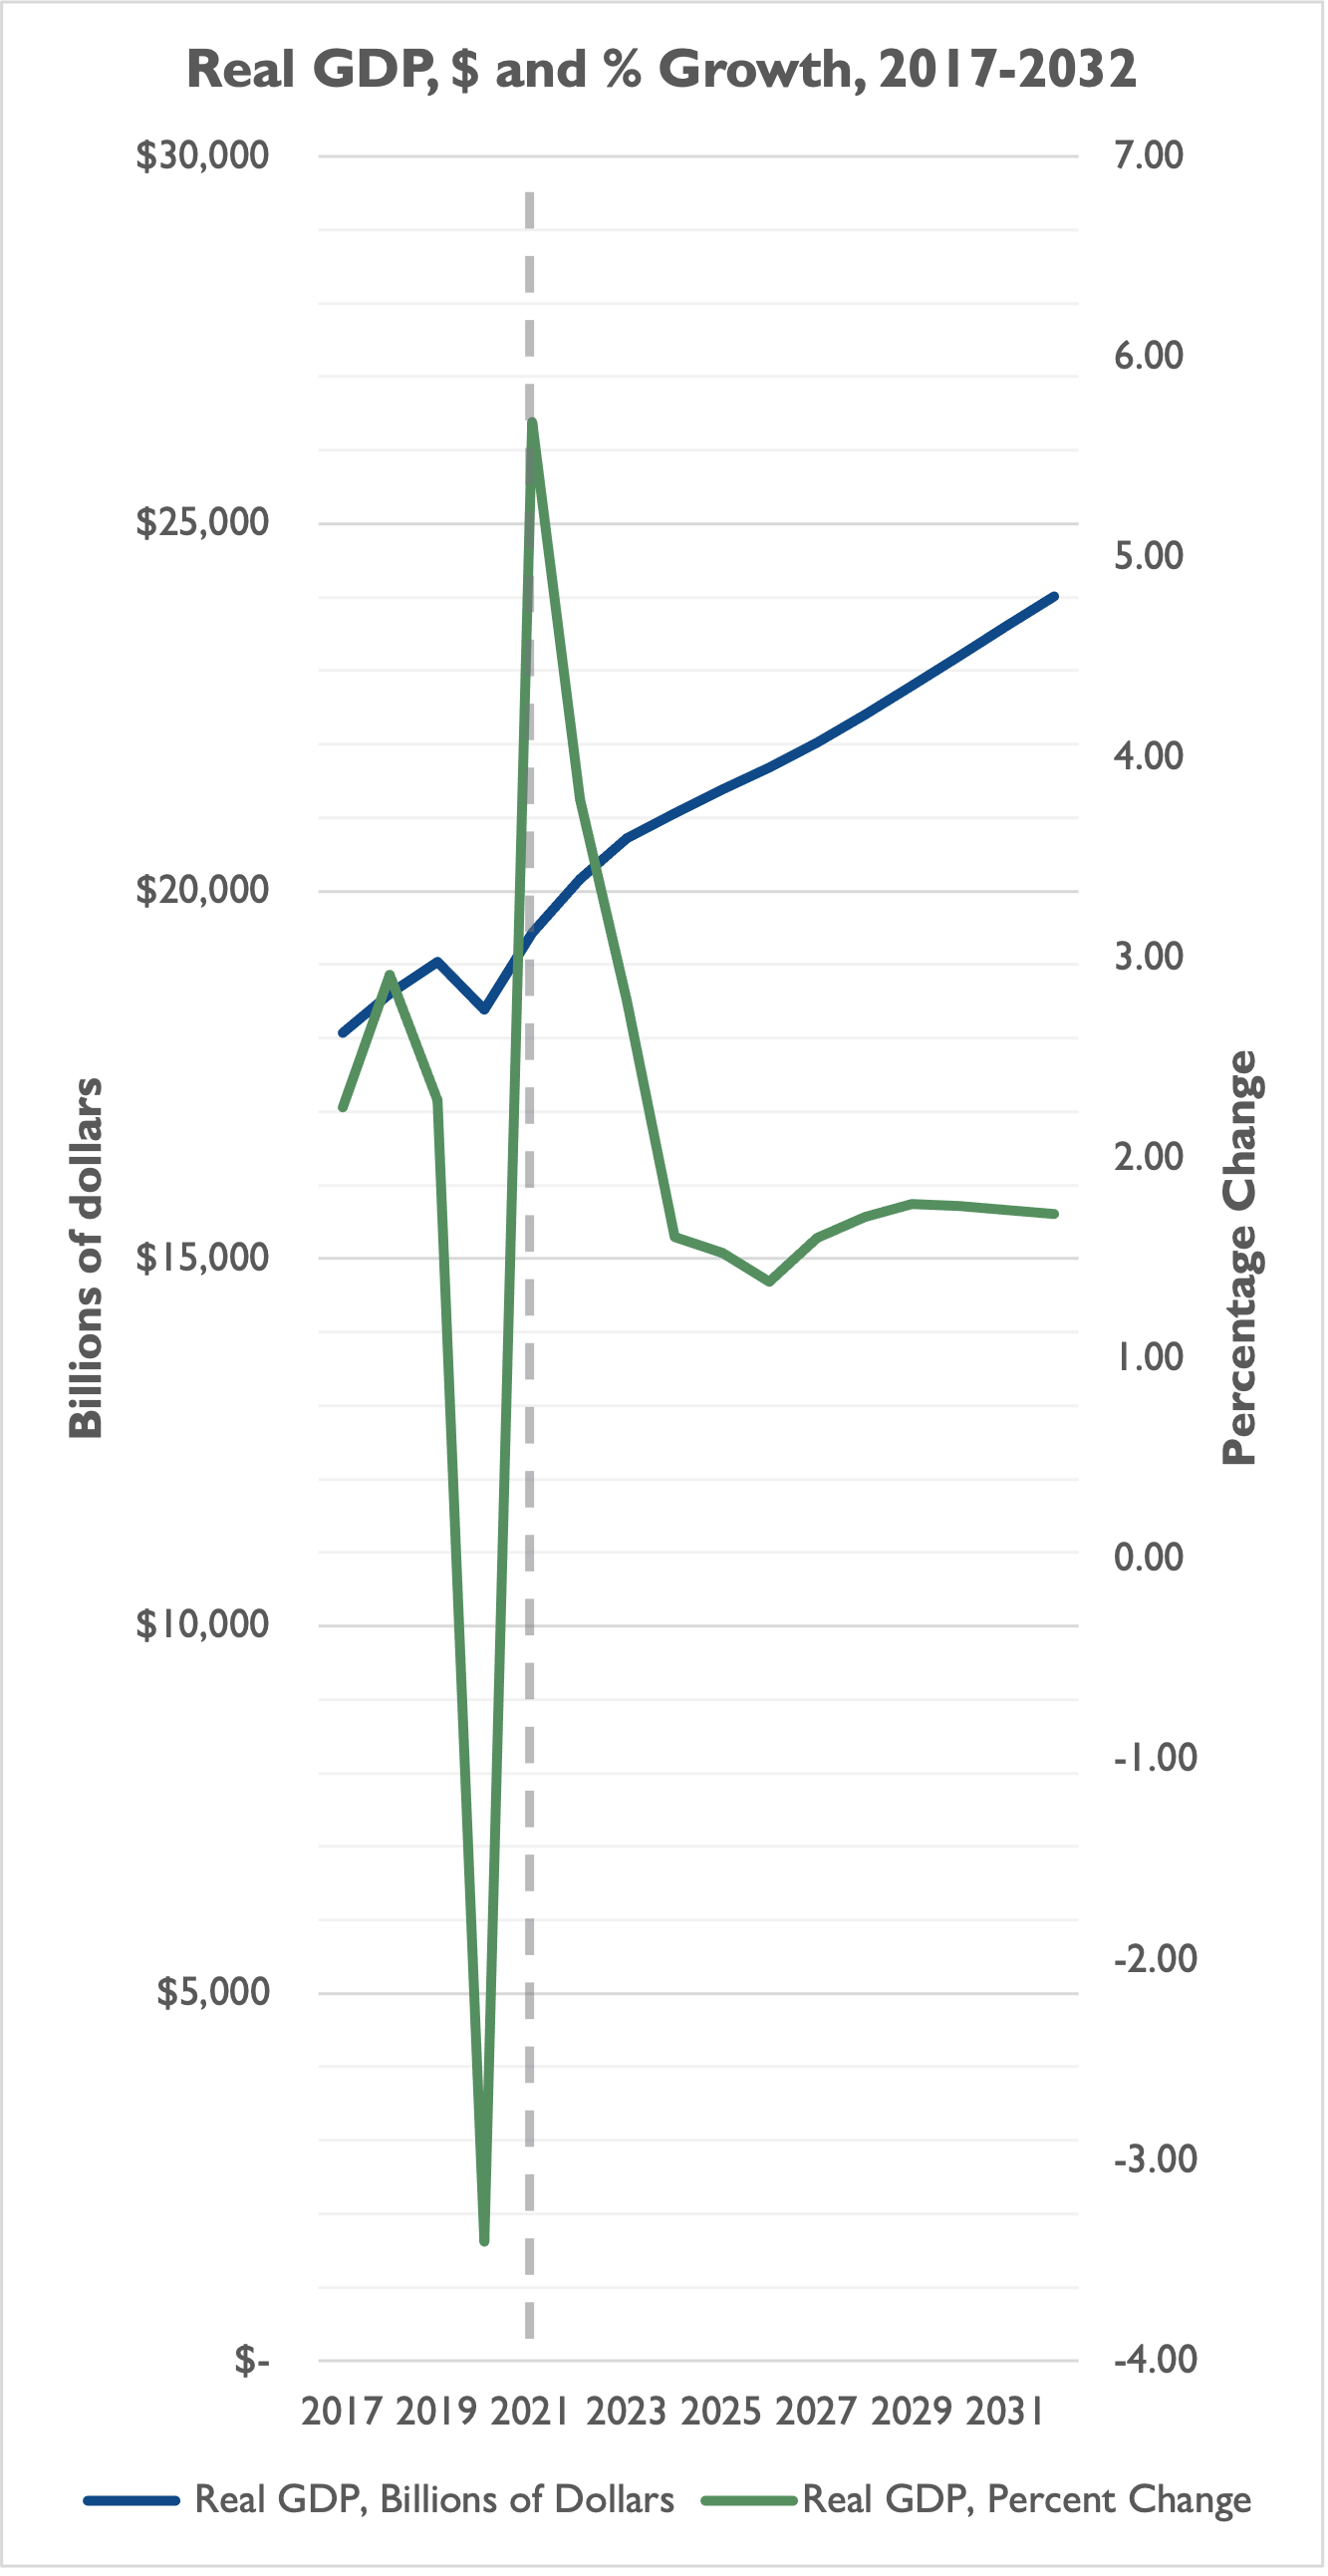
CBO projects that real GDP growth – after plummeting during COVID lockdowns and accelerating during economic reopenings – levels out at between 1.5 percent and two percent per year during the 10-year window. (The gray line represents calendar year 2021, everything to the right of the line is a projection.)
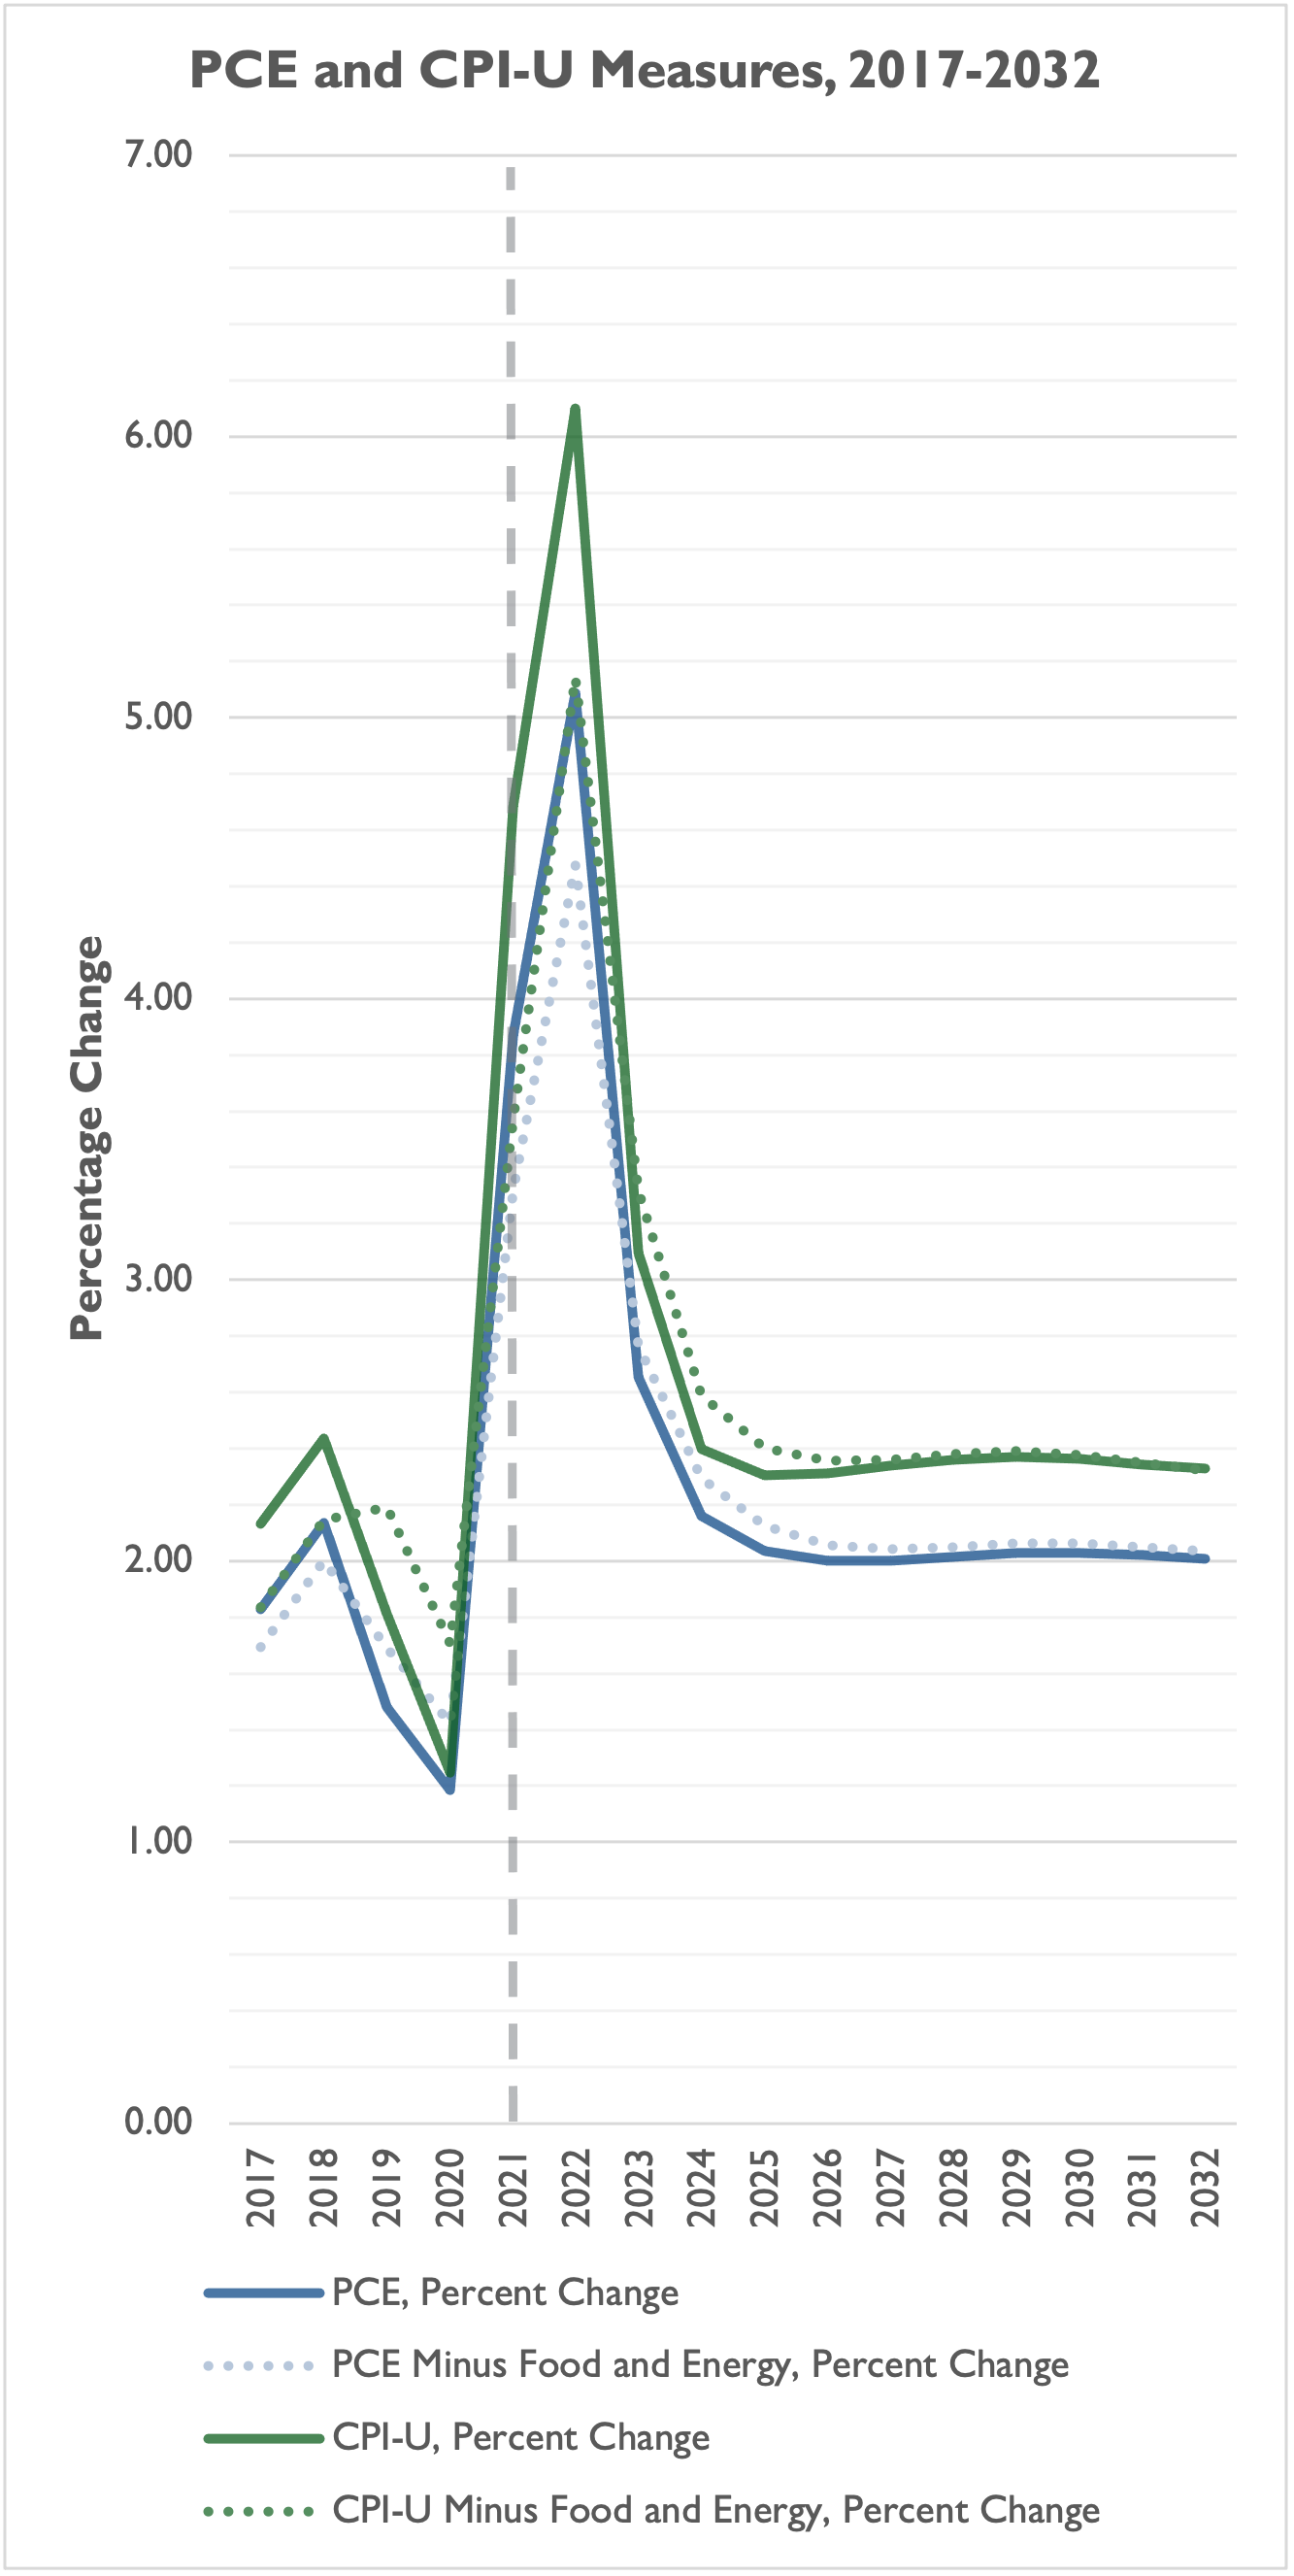
CBO projects that inflation – measured by both the personal consumption expenditure (PCE) index and the consumer price index (CPI-U) – will pop to its highest levels in decades in 2022 (5.1 percent and 6.1 percent, respectively), before falling to around two percent and 2.3 percent (respectively) by calendar year 2024.
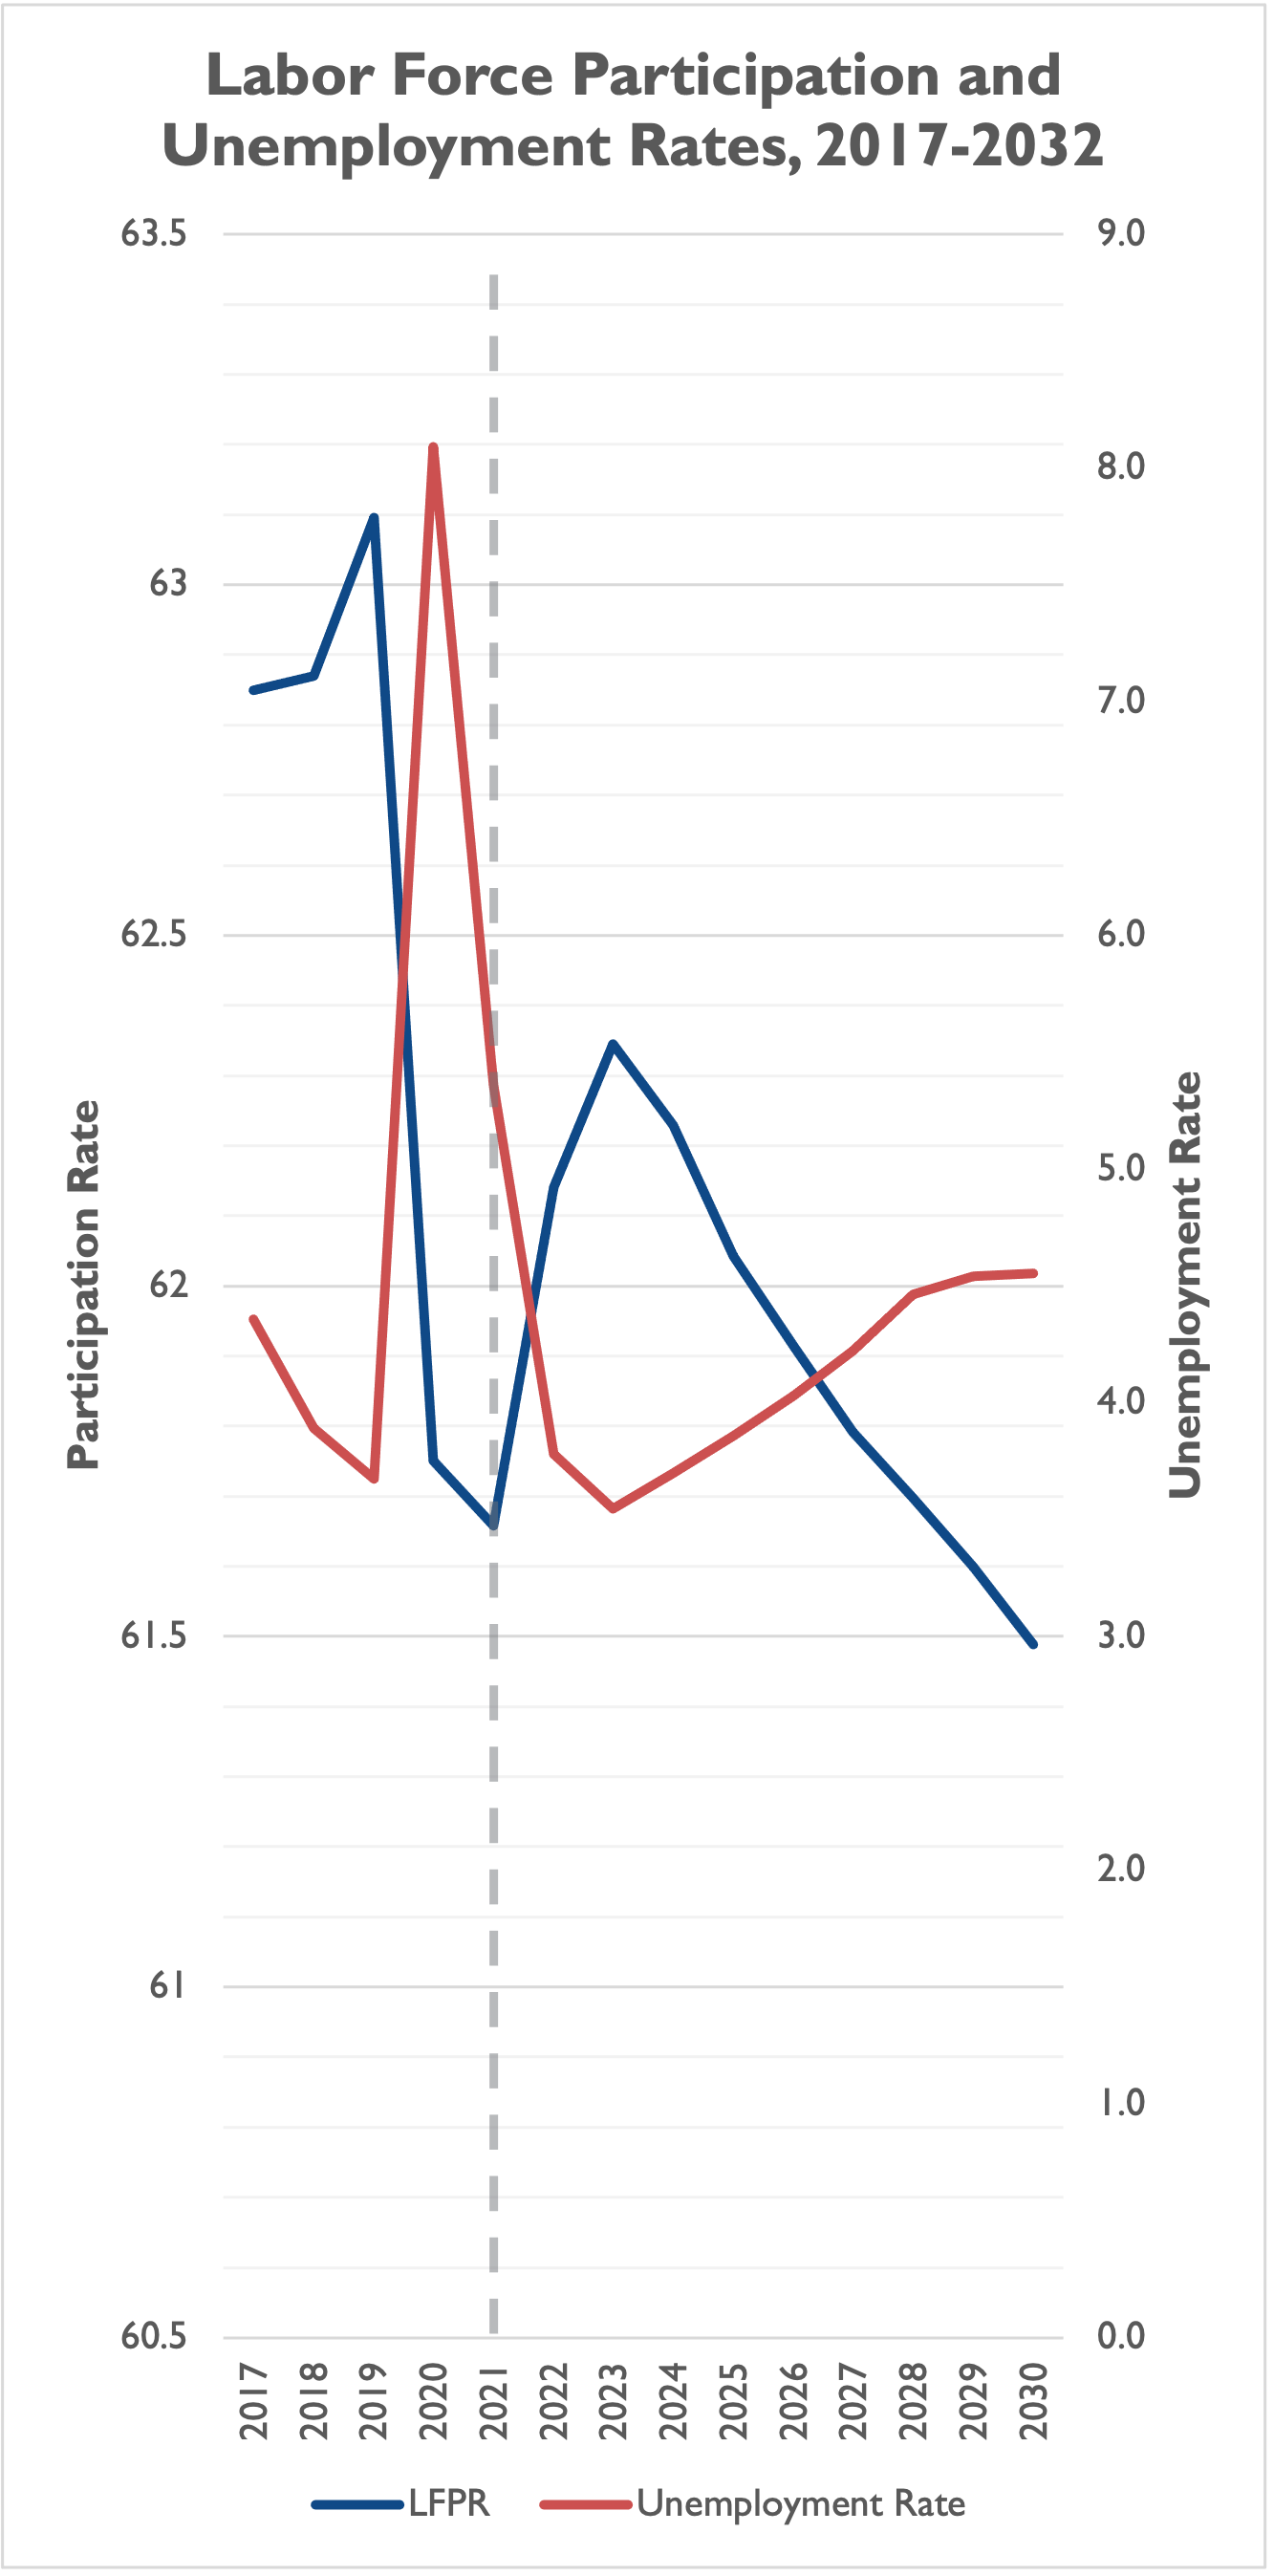
Meanwhile, CBO projects the unemployment rate will hover between 3.5 percent and 4.5 percent over the next decade, while the labor force participation rate steadily declines from 62.3 percent to 61.5 percent.
Of course, these projections are just that – projections. As NTU Foundation’s Demian Brady has explained, CBO’s alternative fiscal scenarios indicate the debt and deficit pictures will be much worse if Congress extends major spending programs or tax expenditures without offsets. And it’s near impossible to predict the movements of the U.S. economy, especially at a time of volatile price increases and supply chain disruptions. Still, the CBO baseline serves as a valuable resource for lawmakers, their staff, and anyone in the general public who is trying to make sense of our unimaginably large government and economy.