(pdf)
Earlier this year, the United States government surpassed an ignominious milestone as the federal debt topped $30 trillion. That is a staggering amount of money surpassing the U.S. Gross Domestic Product (GDP), which currently stands around $23 trillion. That’s nearly equal to the $23.1 trillion in debt held by the public, the amount that excludes intragovernmental debt. Divided up, the gross debt amounts to more than $245,000 per household.
A new National Taxpayers Union Foundation (NTUF) analysis finds that the federal government has spent $193 trillion in 2022 adjusted dollars through Fiscal Year 2021. By examining several sources of historical budget data, NTUF was able to construct a reasonably comprehensive picture of federal spending from the inception of the Constitution in 1789 to the present day. The results paint a picture of stable federal finances with the exception of wartime, with skyrocketing spending and deficits in the post-World War II era.
In constant 2022 dollars, it took 182 years – from 1789 through 1970 – for the government to spend $30 trillion. Nearly half of inflation adjusted total outlays were spent since 2000 – $95 trillion. Of course, it follows that governmental spending has increased over time as the population has grown, new states were added, and the economy expanded. But spending has also increased dramatically over time as a share of GDP and per capita.
The country has changed significantly since the founding, but annual deficit spending has become all too routine. During the first half of the 20th century, the government posted surpluses in 23 years. The second half saw just seven surpluses, and there have been only two years where tax receipts exceeded outlays so far in this new century. As deficits reach progressively higher levels, they could become millstones around the neck of future taxpayers in the form of higher taxes, slower economic growth, and higher interest payments on the ever-growing federal debt.
Spending last year comprised over 40 percent of GDP, the highest since World War II. If spending had been restrained to 18 percent of GDP, the 2021 budget would have shown a surplus. Lawmakers need to make a plan to restrain the growth of outlays to less than the recent historical average for growth in revenues. And they need to stick to a spending reduction plan. All too often, deficit reduction efforts fizzle out after a few years of progress.
Sources of Data and Methodology
This report is based on historical budget data since 1789, the first year of the Congress established by the adoption of the Constitution the previous year. Spending and outlay data since 1901 is available from the Office of Management and Budget’s (OMB) Historical Tables.[1] The years before 1901 are available from the Historical Statistics of the United States: Colonial Times to 1970, published by the Bureau of the Census and the Department of Commerce in 1975 and available online as a pdf document.[2]
The annual outlay figures were converted in 2022 dollars using the historical inflation calculator from officialdata.org.[3] This calculator uses the Bureau of Labor Statistics’ (BLS) Consumer Price Index to measure “the average change over time in the prices paid by urban consumers for a market basket of consumer goods and services.”[4] OMB uses a more complex composite deflator, explaining that the “adjustments to constant dollars are made by applying a series of chain-weighted price indexes to the current dollar database.” OMB’s analysis breaks down changes in spending by defense vs. non-defense and additional categories (see table 10.1 of the Historical Tables). There are some slight variations from year to year compared to CPI, but because OMB's figures are only available since 1929, all the annual figures were converted to 2022 dollars using CPI for consistency.
The concept of measuring and estimating GDP was not adopted in the United States until 1929, after which GDP has been estimated by OMB. This annual data is available from the Federal Reserve Bank of St. Louis’s Federal Reserve Economic Data (FRED), an online database of multiple economic and demographic statistics.[5]
GDP data from 1789 through 1928 was obtained from the website of the MeasuringWorth Foundation.[6]The primary mission of this organization of economists is “to make available to the public the highest quality and most reliable historical data on important economic aggregates, with particular emphasis on nominal (current-price) measures, as well as real (constant-price) measures.” Due to the lack of comprehensive financial and economic data before the adoption of GDP, there is a greater chance for inaccuracy in estimates the further back in time one gets from the modern era. For more background information, the scholars who put together the historical GDP data published an overview of the methodology and ass-umptions they used.[7]The authors also note that they “do not recommend the data be used for sophisticated time series analysis.”While this historical data may not be perfect from year to year, the data set has been widely cited, and it is illustrative of the growth in the economy of the United States for the purposes of this relatively straightforward analysis of the expansion of the federal budget since the founding of the Republic
Population data since 1929 was obtained from the FRED website.[8]Data from before 1929 is available from the Economic History Association.[9]
Findings
Budgetary Milestones
Table 1. How Long Did It Take for Federal Outlays and Revenues to Reach Selected Cumulative Milestones? (In 2022 Dollars) | ||
Milestone in Trillions | Outlays | Revenues |
$1 | 1918 | 1920 |
$10 | 1949 | 1955 |
$20 | 1962 | 1966 |
$30 | 1970 | 1973 |
$40 | 1976 | 1979 |
$50 | 1981 | 1985 |
$60 | 1986 | 1990 |
$70 | 1990 | 1994 |
$80 | 1993 | 1998 |
$90 | 1997 | 2001 |
$100 | 2000 | 2005 |
$110 | 2004 | 2008 |
$120 | 2006 | 2011 |
$130 | 2009 | 2014 |
$140 | 2011 | 2017 |
$150 | 2013 | 2019 |
$160 | 2016 | N/A |
$170 | 2018 | N/A |
$180 | 2020 | N/A |
$190 | 2021 | N/A |
As Table 1 shows, it took until 1918 before the federal government spent its first trillion dollars – a duration of 130 years comprising 55 percent of the time since the establishment of the first Congress. Even after the new income tax went into effect in 1913, tax revenues hit the $1 trillion mark two years later than outlays. After this point, the budget was off to the races as successive trillion-dollar milestones were reached sooner and sooner and total cumulative revenues gradually lagged further behind. In 2013, cumulative spending topped $150 trillion — it took six more years for cumulative revenues to reach that milestone. By the end of Fiscal Year 2021, total spending was close to $193 trillion while total revenues had reached “only” $158 trillion.
Table 2. Number of Years with Deficits vs. Surpluses Since 1800 | ||
| Surpluses | Deficits |
1800-1849 | 33 | 17 |
1850-1899 | 36 | 14 |
1900-1949 | 23 | 27 |
1950-1999 | 7 | 43 |
2000-2021 | 2 | 20 |
During the 1800s, the federal government reported a surplus in 69 years and a deficit in 31 years. After that, deficits became far more common, occurring in 70 years of the 20thcentury. The federal government has managed to run a surplus in just 2 years since 2000, and 9 years since 1950. All this excess spending has piled up $30 trillion in debt through 2022 – as much as spent over the first 182 years of the Republic, through 1970.
Other notable milestones:
- Through the halfway point since 1789, the year 1905, the federal government cumulatively had spent $525 billion, just over a quarter of a percentile of total U.S. spending.
- In terms of budget outlays the halfway point was reached in 1999 when spending surpassed $96.4 trillion. Thus, half of inflation-adjusted total federal spending has occurred in the new millennium alone.
Federal Outlays Over Time
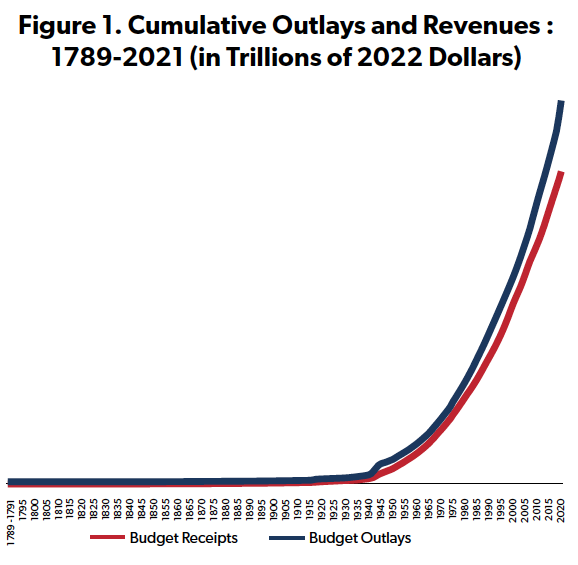
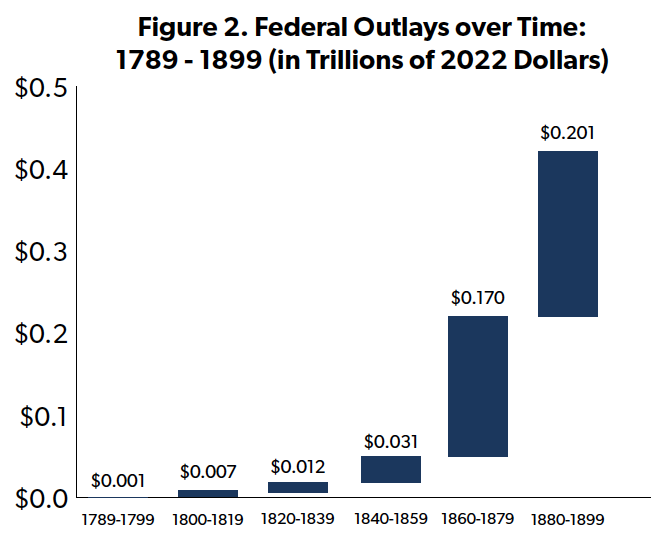
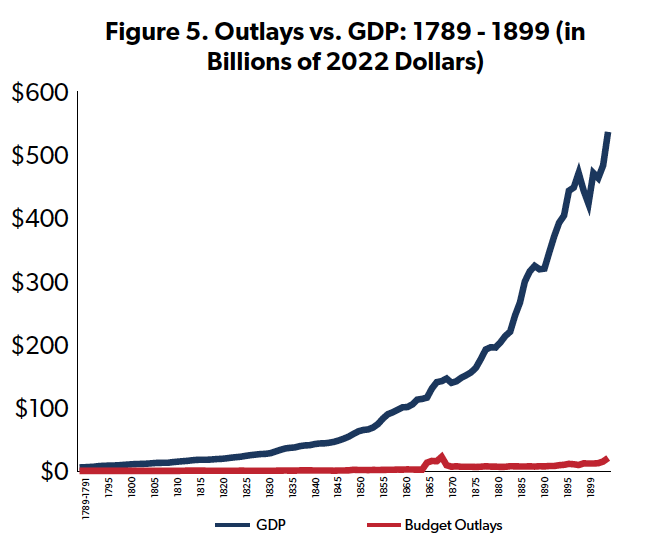
As illustrated in Figure 1, annual spending (in inflation-adjusted dollars) looks relatively flat until the early part of the 20thcentury. Figure 2 zooms in on these early decades since their fiscal impact is nearly imperceptible compared to the spending heights reached in the latter half of the 1900s and onward. As Figure 5 shows, even though the nation’s economy steadily expanded throughout the 1800s, spending as a share of GDP stayed relatively flat at 2.1 percent, on average, until the Civil War, when it spiked to nearly 16 percent in 1865 ($22.4 billion and $627 per capita that year, in 2022 dollars). The post-war Reconstruction Era had average outlays at just over 4 percent of GDP. The average dropped to 2.7 percent during the 1890s, still higher than compared to before the Civil War. The next spike in spending resulted from World War I with outlays reaching $301 billion, $2,861 per capita, and 31 percent of GDP in 1919.
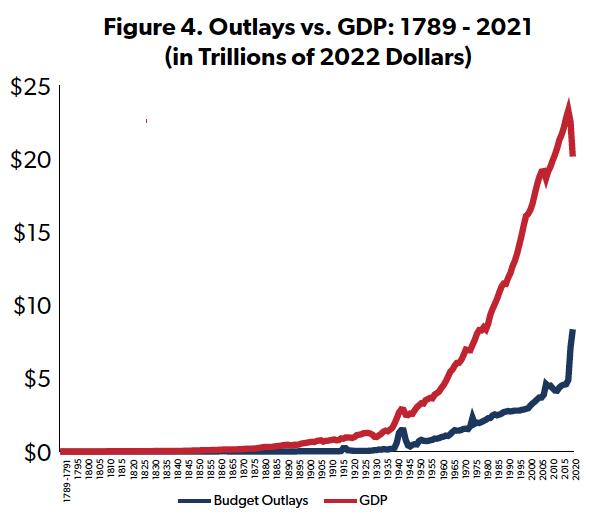
In general, wars obviously have a big immediate impact on spending. However, WWII marks a clear dividing line in U.S. budget history. Before the U.S. entered the global conflict in 1941, spending averaged $241 per capita, and 3.9 percent of GDP. During the war, spending soared, amounting to over $10,000 per person and exceeding 50 percent of GDP. (For comparison, the closest it came to reaching that height occurred last year in 2021, with outlays comprising 35 percent of GDP and costing more than $25,000 per person.)
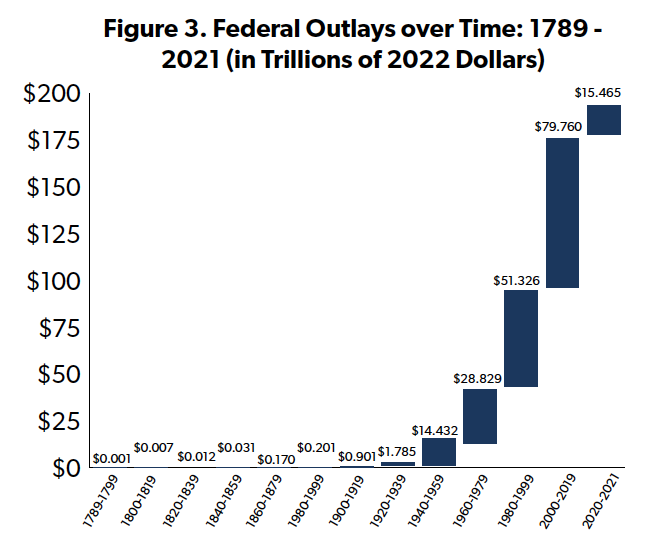
As Figure 3 shows, outlays grew significantly in each successive decade after WWII. From 1946 on, spending averaged 22.5 percent of GDP and $9,287 per capita. Outlays per decade increased steadily in the post war decades partly due to the Cold War against the Soviet Union which boosted defense budgets. Historical Table 8.3 in the annual budget shows spending by Budget Enforcement Act category as a percentage of total outlays since 1962[10]. From 1962 through 2021, defense outlays have averaged 24.9 percent of all spending each year.
The sharp growth in spending is also attributable to the establishment and expansion of welfare entitlement programs since the New Deal, including:
- Social Security: Established in 1935, since 1962 it has comprised 20 percent of all outlays;
- Medicare: This program began offering coverage in 1966, since 1967 it has comprised 9 percent of all outlays; and
- Medicaid: This was established in 1965, building on the 1960 Medical Assistance to the Aged program. Since 1962, Medicaid spending has comprised 5 percent of all outlays.
In addition, Table 8.3 accounts for 29 additional means-tested entitlement programs that have comprised 12 percent of all outlays since 1962. These include Temporary Assistance to Needy Families, the Children's Health Insurance Program, child nutrition programs, veterans' pension benefits, and several refundable credits including the health insurance premium tax credits included in the Affordable Care Act). It also includes recently established coronavirus-related programs which drove this category of spending up to 26 percent of all outlays in 2020 and 23 percent in 2021. A full list of the programs is included in the note section of the Historical Tables.[11]
Spending Grew as a Share of GDP and per Capita Even as the Population Grew
It is expected that spending would gradually increase because of the massive increases over time in the economy due to the expansion of the population and also as a result of increased productivity. But as Figure 8 shows, spending dramatically increased as a share of GDP after WWII, more than doubling where it stood before WWII.
Table 3 shows how much spending has expanded as a share of the population. At the dawn of the 20th century, outlays amounted to $217 per person. By the 1950s, as the population doubled, spending swelled to over $4,340 per person. This level more than doubled to $11,909 in the first decade of the current century.
The current decade only includes two years of data, but so far is incredibly high when compared to previous periods of time, with average outlays reaching 36.5 percent of GDP and nearly $23,300 per person. Looking ahead, outlays had been expected to slow as pandemic-related outlays wound down. However, there are serious economic and fiscal headwinds against not just the U.S., but also the entire global economy. Upward pressure from supply chain issues, inflation across vast swaths of consumer goods, and the uncertain prospects resulting from Russia’s war on Ukraine could lead to higher than otherwise anticipated spending for 2022 and the next few years. In other words, counting on spending to return to “normal” in future years falsely imagines that challenges and crises are restricted only to the here and now.
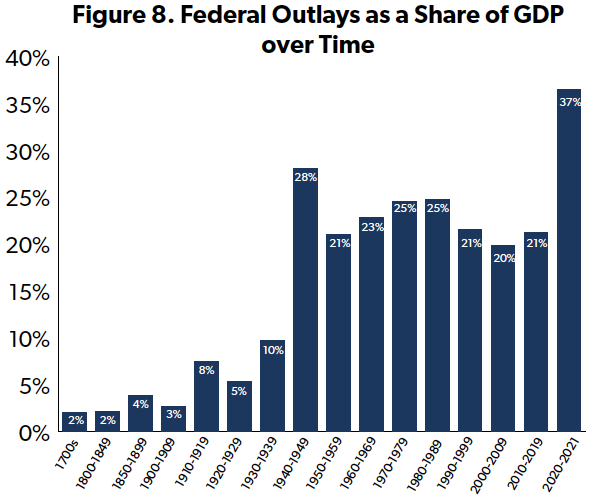
Table 3. Average Federal Outlays per Capita over Time | |
1700s | $34 |
1800-1849 | $47 |
1850-1899 | $170 |
1900-1909 | $217 |
1910-1919 | $637 |
1920-1929 | $497 |
1930-1939 | $957 |
1940-1949 | $5,221 |
1950-1959 | $4,341 |
1960-1969 | $5,888 |
1970-1979 | $8,087 |
1980-1989 | $9,878 |
1990-1999 | $10,513 |
2000-2009 | $11,909 |
2010-2019 | $13,896 |
2020-2021 | $23,290 |
Spending Limits Are Needed to Balance the Budget
As NTU’s Andrew Lautz detailed in a comprehensive report last year, the federal budget process is badly in need of repair.[12]Budget deadlines are rarely met, and budget gimmicks are frequently used as phony offsets. When there were fiscal targets, they were rarely adhered to. And in the post-Budget Control Act (BCA) period exacerbated by the pandemic and economic crises, there are no longer any meaningful policies in place to provide a check on congressional spending. Even though Congress gradually whittled away the spending restraints in the BCA of 2011, that law helped to reset the trajectory of federal spending lower than it would have been otherwise. Washington needs a successor law, a “BCA 2.0” to help guide the federal budget towards balance with a renewed effort to slow the growth in spending.
One option would be to restrict spending as a share of GDP. For example, outlays in FY 2021 amounted to $8.3 trillion in 2022 dollars. This amount reflects 41.4 percent of GDP, or $25,132 per person. If spending had been restrained to the average level of spending as a share of the economy since 2000 (20.5 percent) outlays would have amounted to $4.1 trillion, falling shy of the tax revenues collected that year, $4.2 trillion.
Since lawmakers tend to shake off spending controls they impose on themselves, there are also proposals to add an amendment to the Constitution prescribing limits on spending. Successful passage would require approval in both the House and Senate and ratification by 38 states within seven years. In 1995, the House passed a Balanced Budget Amendment (BBA) by a 300-132 vote but fell one vote short in the Senate.[13]
Among several other recent proposals for a constitutional amendment include:
- Representative Steve Chabot’s (R-OH) BBA, with 49 cosponsors, is the most similar to the version passed in 1995.[14]It would prohibit total outlays for a fiscal year from exceeding total receipts for that fiscal year unless Congress authorizes the excess by a three-fifths roll call vote;
- The companion proposals introduced in the House by Representative Jodey Arrington (R-TX) and in the Senate by Senator Mike Braun (R-IN) are similar to Chabot’s version but also adjusts for changes in inflation and population;[15]
- The BBA introduced in this Congress by Senator Cindy Hyde-Smith (R-MS), along with 15 cosponsors, would limit spending to 18 percent of GDP (for a point of reference, outlays in 2000 amounted to 18.2 percent of that year’s GDP);[16]and
- Former Representative Justin Amash’s (I-MI) Business Cycle Balanced Budget Amendment which would establish an expenditure level based on a three-year average of prior revenues plus adjustments for inflation and population growth;[17]
If a constitutional limit on spending to 18 percent of GDP, outlays for 2021 would have totaled $3.7 trillion. However, a properly implemented BBA tied to GDP would incentivize Congress to spur private sector economic growth.
The Congressional Budget Office has laid out the risks to the country if Congress fails to cut back deficits. Deficit spending crowds out private investment, holding back real economic growth. Annual deficits also limit fiscal tools available to policy makers to respond to the next unforeseen economic crisis. And eventually, future generations will pay the price through either high taxes or a dampened economy, or both.
Conclusion
As the array of charts and tables above illustrate, policymakers have been blithely piling on federal debt nearly every single year over the past several decades. In the process, very little consideration is given to the consequences that will be borne by future generations of Americans from these poor budget practices. Some progressive economists have even devised a daft new “Modern Monetary Theory” to justify the national debt far surpassing its $30 trillion milestone.
Sid Taylor, a former NTUF analyst and wordsmith whose fiscal poetry has been read into the Congressional Record, used to say, “The federal debt will get you yet.”[18]Without reforms on out-of-control federal spending, the day of reckoning will weigh like a millstone around the neck of future taxpayers.
[1]Office of Management and Budget. (2022). Historical Tables: Budget of the United States Government. Retrieved from https://www.whitehouse.gov/omb/historical-tables/. In this publication, the budget data for the years 1989 through 1791 are totaled together.
[2]United States Census Bureau. (1975). Bicentennial Edition: Historical Statistics of the United States, Colonial Times to 1970. Retrieved from https://www.census.gov/library/publications/1975/compendia/hist_stats_colonial-1970.html.
[3]OfficialData.org. (2022). CPI Inflation Calculator. Retrieved from https://www.officialdata.org/us/inflation.
[4]U.S. Bureau of Labor Statistics. (2022). Consumer Price Index. Retrieved from https://www.bls.gov/cpi/.
[5]Federal Reserve Bank of St. Louis. (2022). Federal Reserve Economic Data. Retrieved from https://fred.stlouisfed.org/series/GDPCA.
[6]MeasuringWorth Foundation. (2022). What Was the U.S. GDP Then?. Retrieved from https://www.measuringworth.com/datasets/usgdp/.
[7]Johnston, Louis and Williamson, Samuel H. Sources and Techniques Used in the Construction of Annual GDP, 1790-Present. MeasuringWorth. 2022. Retrieved from https://www.measuringworth.com/calculators/uscompare/GDPsource06.htm.
[8]Federal Reserve Bank of St. Louis. (2022). Federal Reserve Economic Data. Retrieved from https://fred.stlouisfed.org/series/GDPCA.
[9]Economic History Association. (2022). U.S. Population Series. Retrieved from https://eh.net/database/u-s-population-series/.
[10]Office of Management and Budget. (2022). Historical Tables of the United States Government: Table 8.3—Percentage Distribution of Outlays by Budget Enforcement Act Category: 1962–2027. Retrieved as an XLSX file from https://www.whitehouse.gov/wp-content/uploads/2022/03/hist08z3_fy2023.xlsx.
[11]Office of Management and Budget. (2022). Introduction to the Historical Tables. Retrieved from https://www.whitehouse.gov/wp-content/uploads/2022/03/hist_intro_fy2023.pdf.
[12]Lautz, Andrew. The Budget Control Act of 2021: A Roadmap for Congress. National Taxpayers Union. January 13, 2021. Retrieved from https://www.ntu.org/publications/detail/the-budget-control-act-of-2021-a-roadmap-for-congress.
[13]The final vote was actually 65-35, but this was because Senate Majority Leader Bob Dole (R-KS) switched his vote for procedural reasons so that he could bring the measure back to the floor later in the congressional session.
[14]Representative Steve Chabot. (2021). H.J.Res.3 - Proposing a balanced budget amendment to the Constitution of the United States. Retrieved from https://www.congress.gov/bill/117th-congress/house-joint-resolution/3.
[15]Representative Jodey Arrington. (2022).H.J.Res.77 - Proposing a balanced budget amendment to the Constitution of the United States. Retrieved from https://www.congress.gov/bill/117th-congress/house-joint-resolution/77. Senator Mike Braun. S.J.Res.42 - A joint resolution proposing a balanced budget amendment to the Constitution of the United States. Retrieved from https://www.congress.gov/bill/117th-congress/senate-joint-resolution/42.
[16]Senator Mike Crapo. (2021). Crapo, Risch Introduce Balanced Budget Amendment. Retrieved from https://www.crapo.senate.gov/media/newsreleases/crapo-risch-introduce-balanced-budget-amendment.
[17]Moylan, Andrew. “Support the Business Cycle Balanced Budget Amendment!” National Taxpayers Union. September 22, 2011. Retrieved from https://www.ntu.org/publications/detail/support-the-business-cycle-balanced-budget-amendment.
[18]Representative Andrew Jacobs, Jr. (1996). “ Celestial Economics (By Sid Taylor, Fiscal Poet).” Retrieved from Congressional Record Extensions of Remarks Articles | Congress.gov | Library of Congress