
The annual publication of Internal Revenue Service (IRS) Statistics of Income (SOI) data gives us at National Taxpayers Union Foundation (NTUF) an annual look of what types of households are paying the most and the least amounts of income tax, data that informs our popular annual report “Who Pays Income Taxes?”
Other important questions the annual IRS data can help us answer are: who’s in the one percent? Who’s in the ten percent? Who’s in the top half of American income earners?
These questions are important because politicians and even entire socioeconomic movements have built their reputations and their policy proposals around reducing the wealth and income of “the one percent.”
So just who is the one percent in America?
IRS SOI data from 2020 – the year recently made available by the tax agency for the first time – shows that a household had to report at least $548,336 in income in 2020 to be considered among the top one percent of tax filers. To be in the top tenth-of-a-percent, a household had to report more than $2.6 million in income.
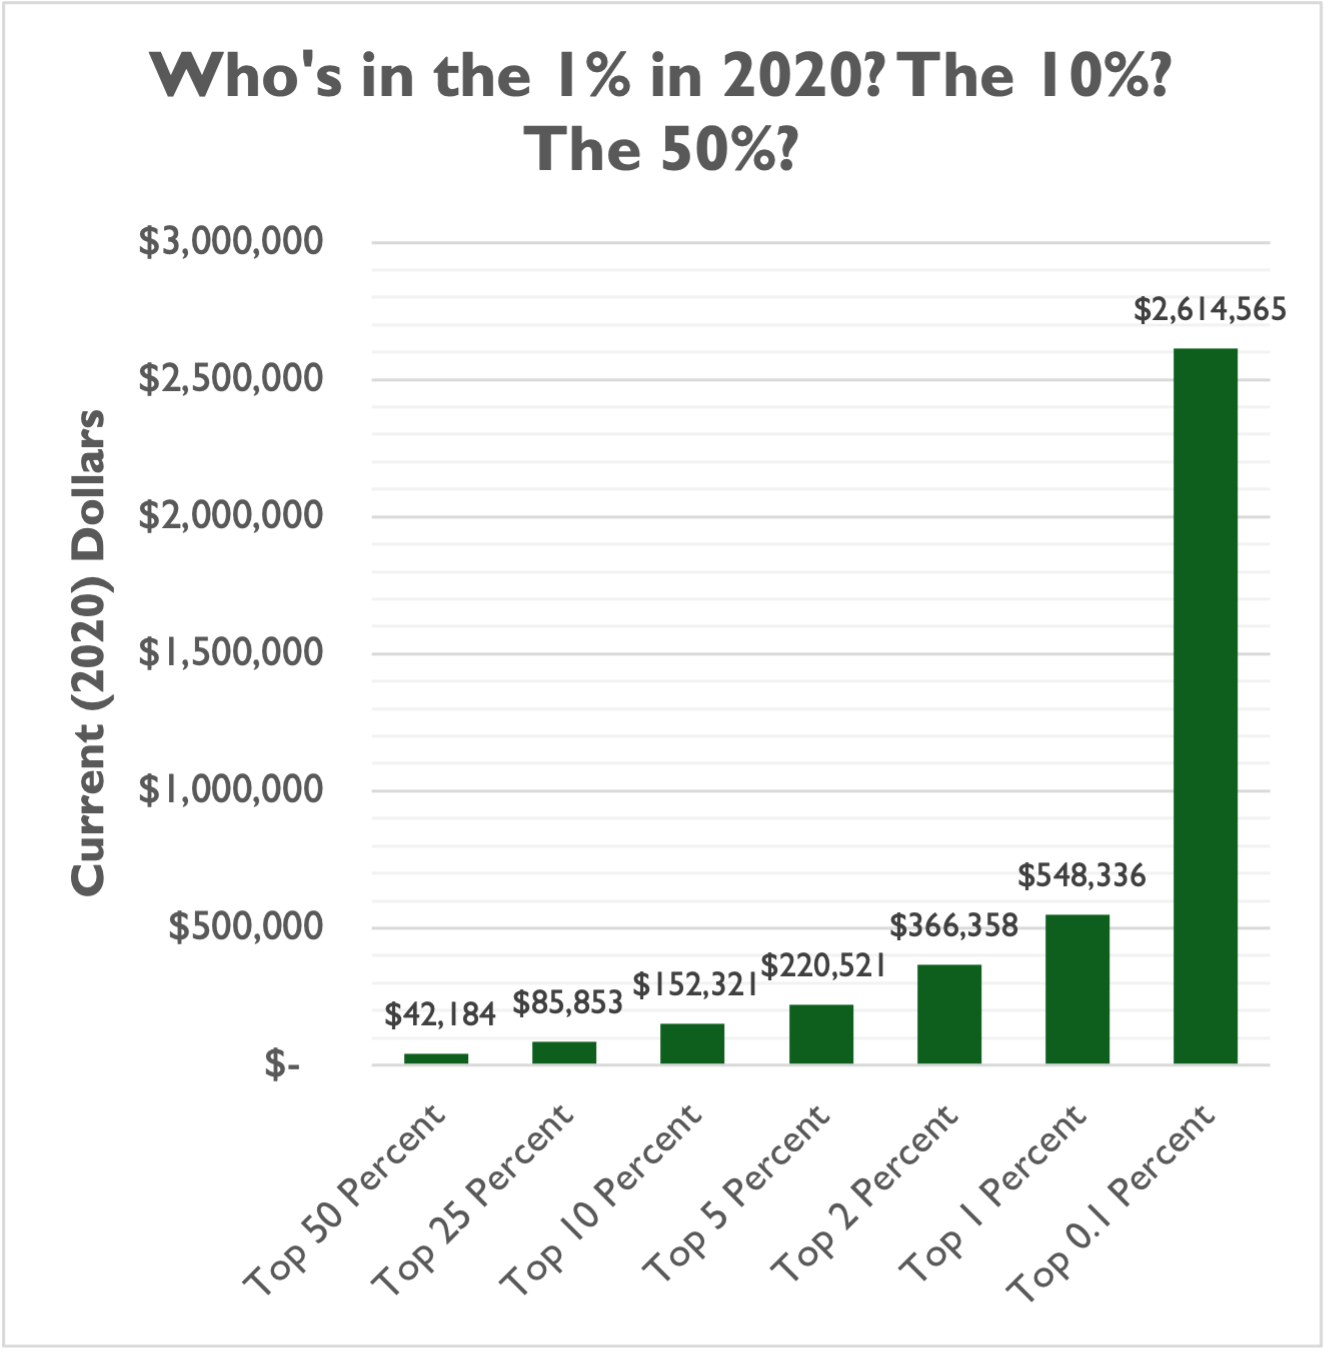
What may surprise some readers are the thresholds that determine membership in the top two percent, the top five percent, the top 10 percent, and so on.
To be in the top two percent, a household had to report more than $366,358 in income. But for the top five percent, that threshold was only $220,521 – below the thresholds of the top three income tax brackets for married filers in our seven-bracket federal income tax code. The threshold to put a household in the top 10 percent was only $152,321, and the threshold for the top 25 percent was $85,853. If you made $42,185 in gross income in 2020, you were just barely in the top half of all tax-filing households.
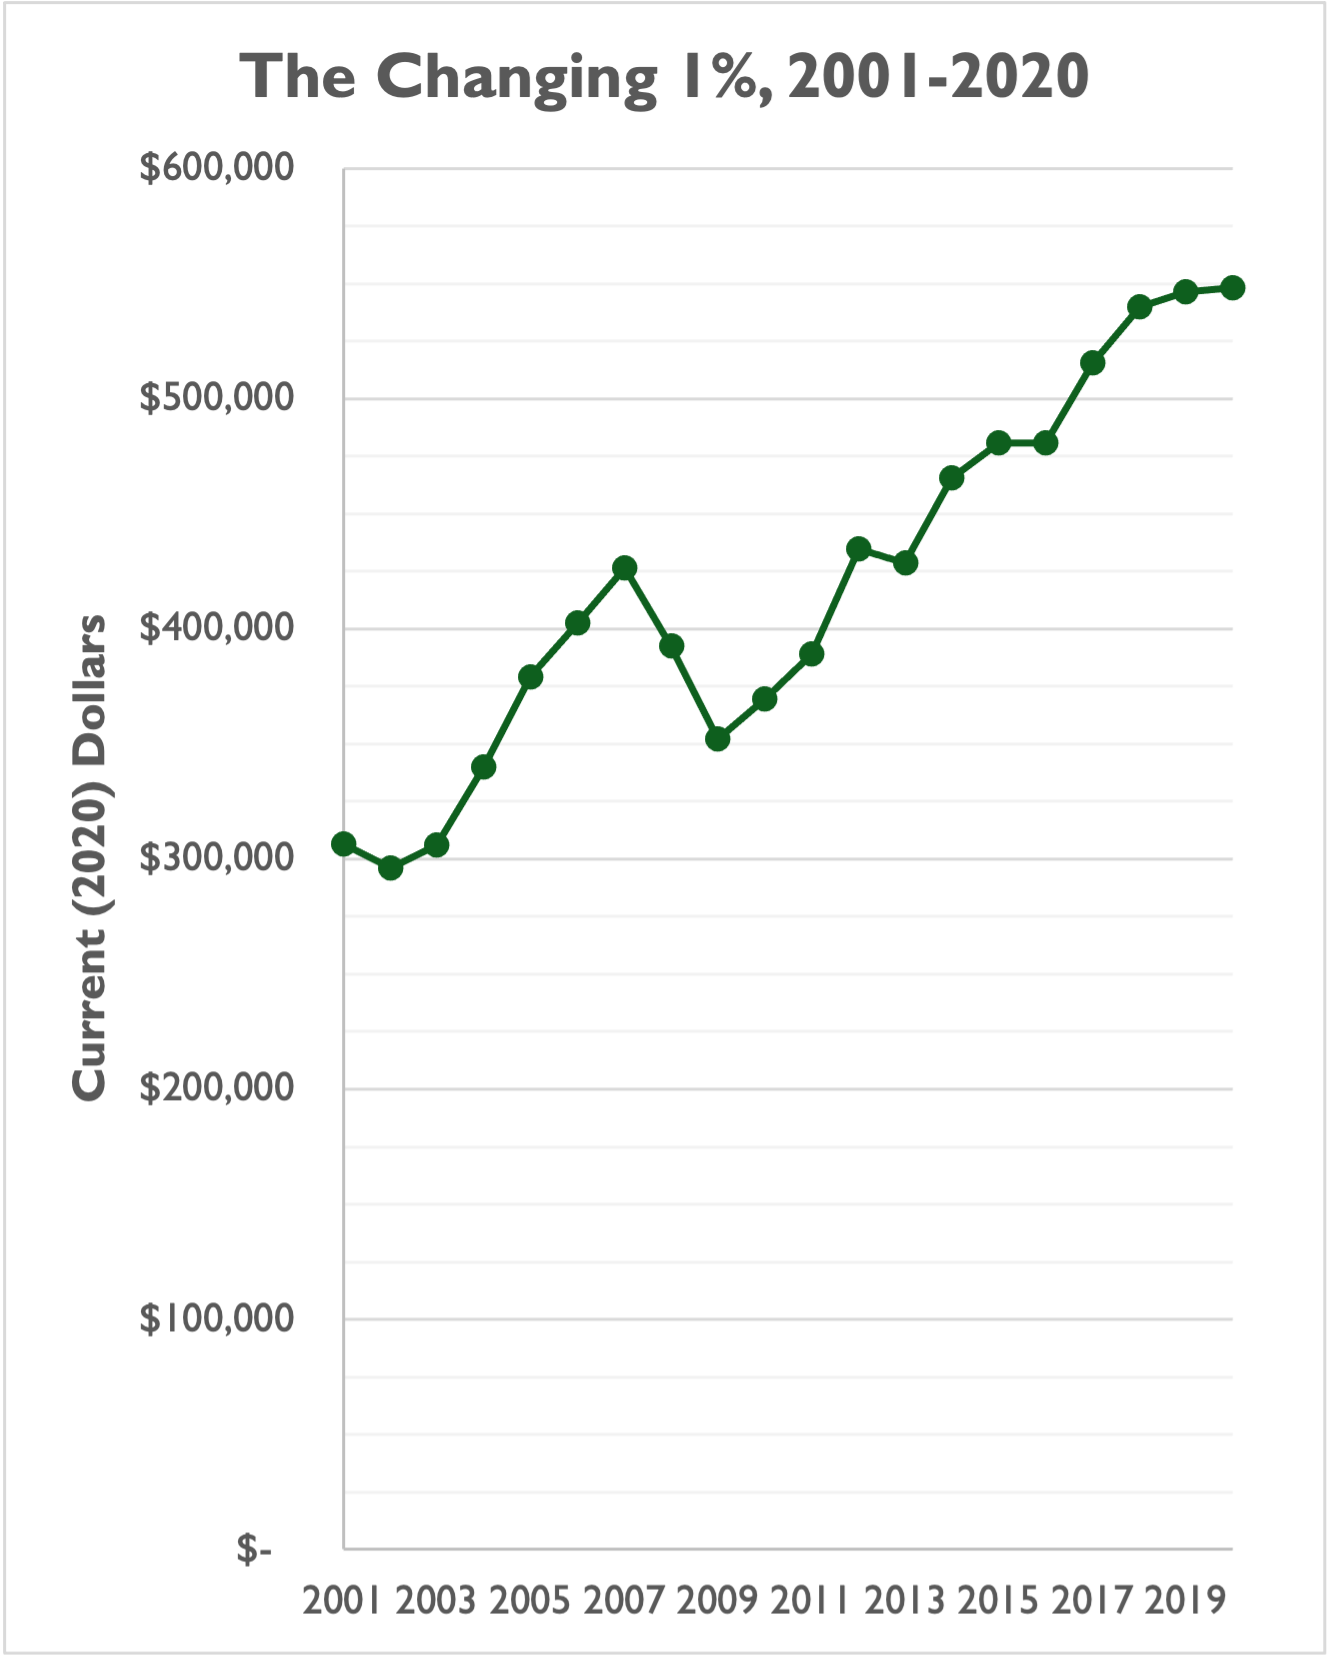
Of course, these thresholds have changed over time.
In 2001, a household only had to make around $300,000 to be considered in the top one percent of income-earning households. Today that number has nearly doubled, to almost $550,000.
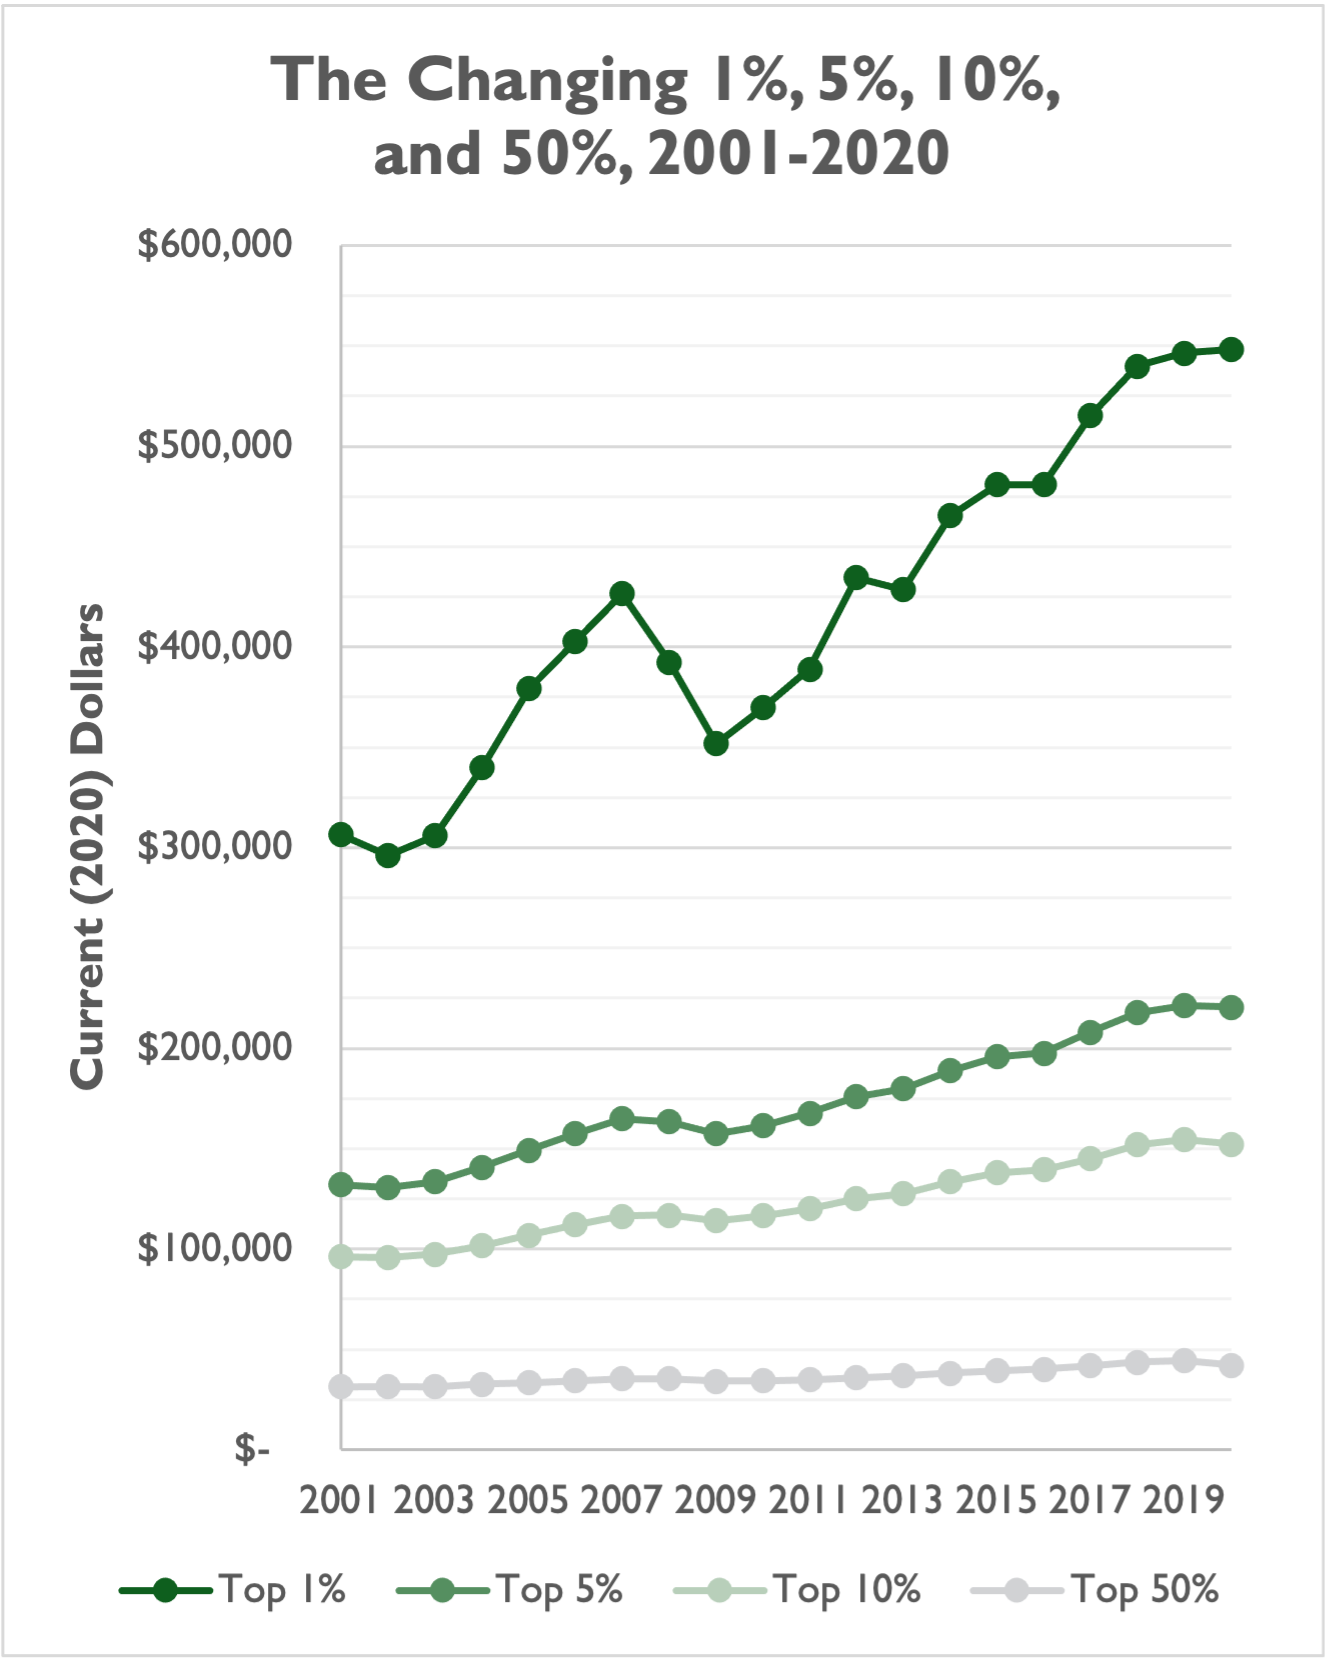
In 2001, the top half of households made $31,418 or more. The top 10 percent made $96,151 or more. And the top five percent made $132,082 or more. All of those thresholds are much higher in 2020, but have not experienced the same growth as the one percent threshold.
There’s a lot of talk over whether or not the rich “pay their fair share” in taxes. Much of the debate is subjective. But IRS data indicate that, at least when it comes to share of gross income vs. share of total income tax paid, the wealthiest Americans do pay a larger share of taxes than the share they receive in income.
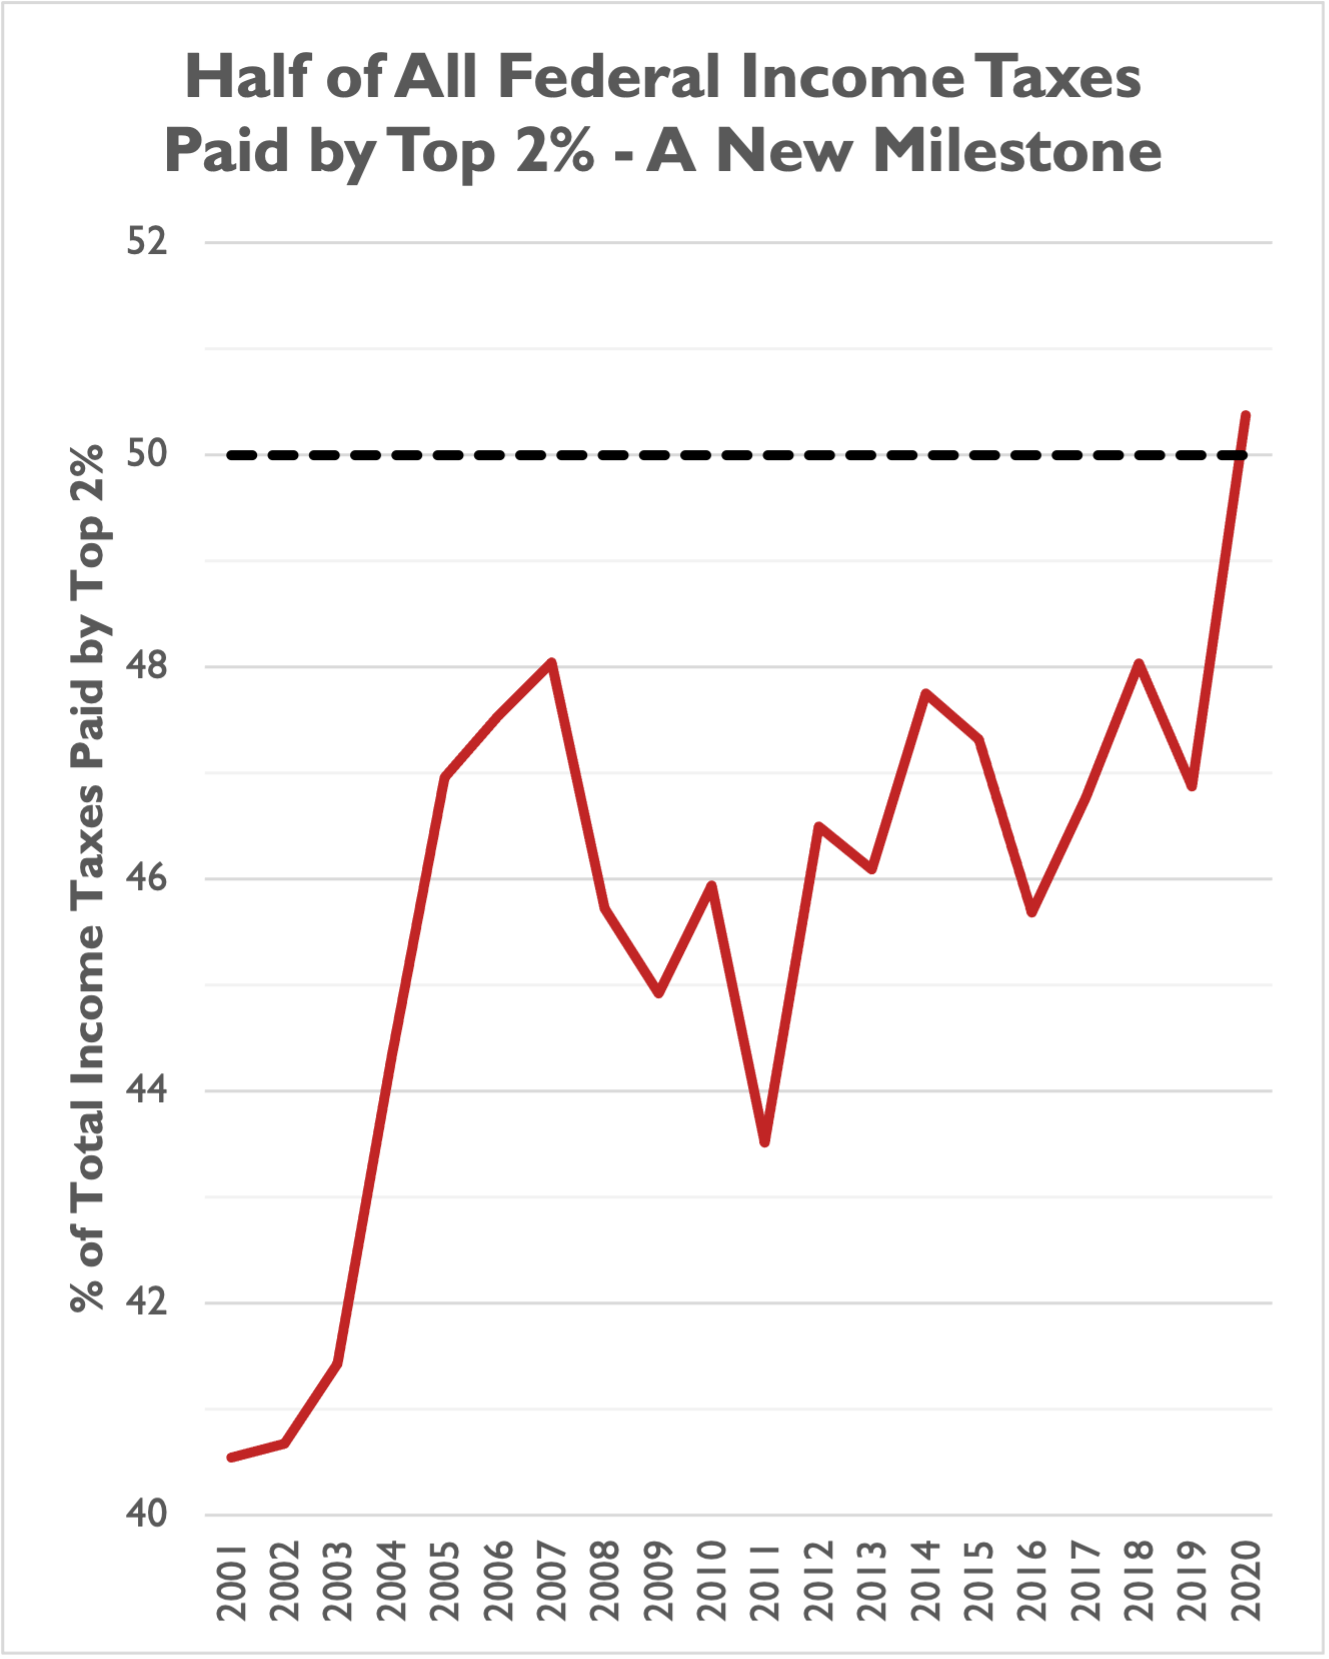
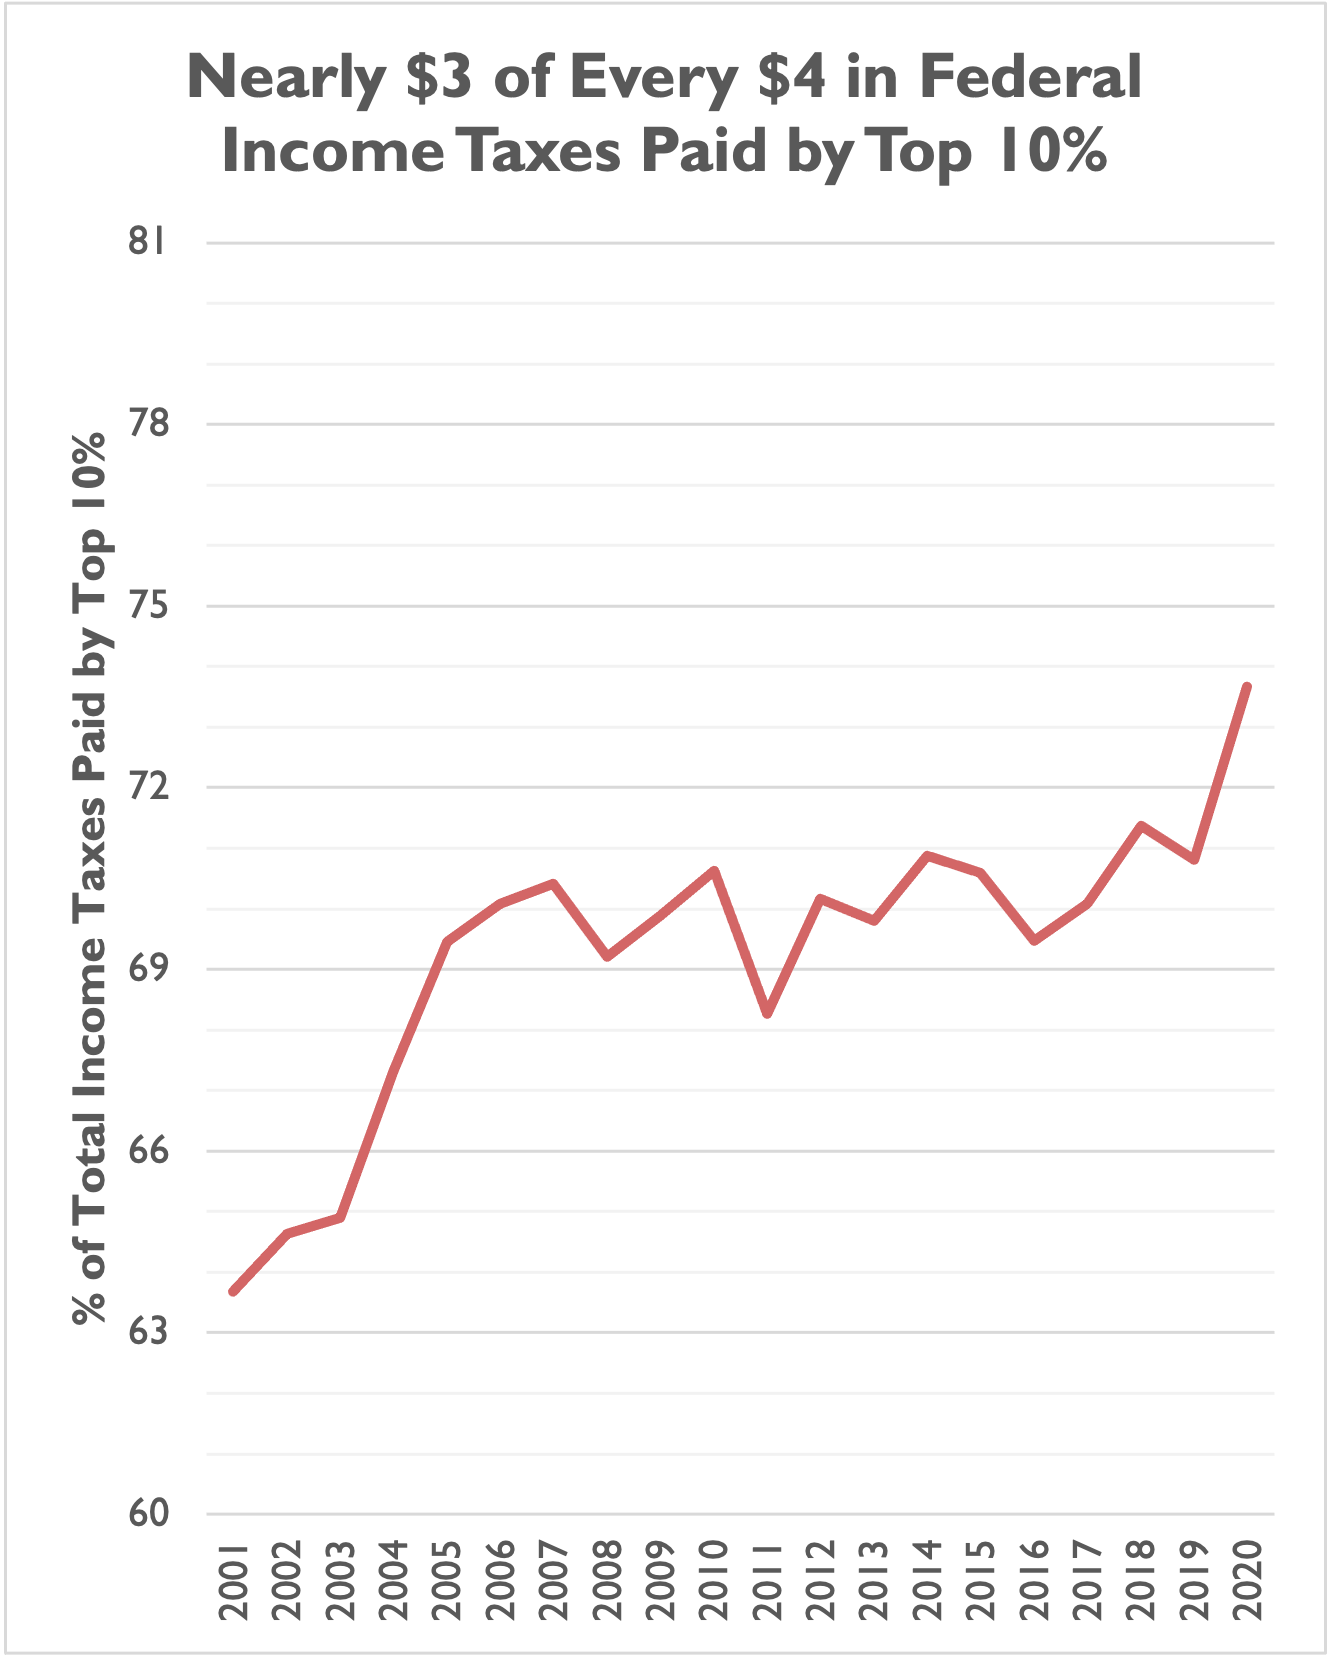
The top one percent, for example, reported 22.19 percent of all gross income in 2020, but paid 42.31 percent of all federal income taxes. The top two percent reported 27.72 percent of all income, but paid 50.37 percent of taxes. The top 10 percent reported 49.45 percent of all income and paid 73.67 percent of taxes.
The bottom 50 percent, on the other hand, reported only 10.18 percent of all income, but also paid only 2.32 percent of all taxes.
| Top 1% | Top 2% | Top 10% | Top 25% | Top 50% | Bottom 50% |
Share of Gross Income (2020) | 22.19% | 27.72% | 49.45% | 70.71% | 89.82% | 10.18% |
Share of Total Income Tax (2020) | 42.31% | 50.37% | 73.67% | 88.51% | 97.68% | 2.32% |
Share of Standard Deduction Value (2020) | 0.53% | 1.26% | 9.45% | 27.22% | 53.93% | 46.07% |
Share of Itemized Deductions Value (2020) | 26.75% | 32.99% | 57.38% | 77.70% | 92.85% | 7.15% |
And we soon may approach another significant milestone: the top 10 percent of income earners paying $3 out of every $4 in federal income taxes, after a big jump in the top 10 percent’s share from 2019 to 2020.
There are some limitations to this data, however. First, this data is just federal income taxes, not other federal taxes (such as payroll taxes or business taxes) or state/local taxes. Second, 2020 was an odd year due to the economic and tax effects of the pandemic, so we will await 2021 IRS data next year to see if these trends continue. Third, income reported to the IRS is not the same as wealth, so these data should only be used as a proxy for who’s in the top one percent of income earners in the nation. Fourth, income can be volatile from year to year, meaning this year’s one percenter might be a two percenter or a 10 percenter next year. Finally, the IRS treats married taxpayers filing jointly as one household – one taxpayer – which limits our ability to tease out the separate incomes of joint filers.
Those limitations aside, the annual IRS data provides important information and context to the ongoing debates of who’s wealthy, who’s in the one percent, and who should be subject to new or expanded taxes.