
(pdf)
Introduction
Many left-leaning politicians have argued that the tax system is rigged to benefit those at the top and that the wealthy are not paying their “fair share” of taxes. These claims overlook the starkly progressive nature of America’s income tax code. The code has become increasingly progressive over the past several decades, and despite much political rhetoric to the contrary, the 2017 Tax Cuts and Jobs Act (TCJA) made it even more progressive by shifting a greater share of the income tax burden to the top earners.
New data from the Internal Revenue Service (IRS) for the first tax year under the TCJA confirms that even as the tax reform law reduced top marginal tax rates, the top income earners shouldered a larger share of the income tax burden, far exceeding their adjusted gross income share. Lower income earners are largely spared from income taxes and actually paid a smaller share under the TCJA’s reforms.
New Data Highlights Progressivity of the Income Tax Code under the TCJA
Each fall the IRS’s Statistics of Income division publishes data showing the share of taxes paid by taxpayers across ranges of Adjusted Gross Income (AGI). The most recent release covers Tax Year 2018 (filed in 2019).[1] This is the first year of reported data under the changes in the TCJA which lowered tax rates, nearly doubled the standard deduction, and expanded the child tax credit.
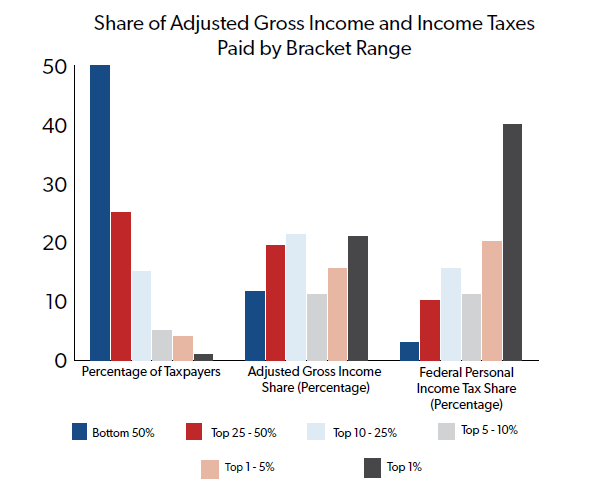
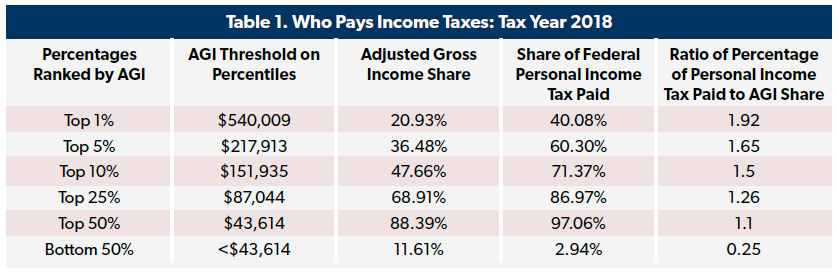
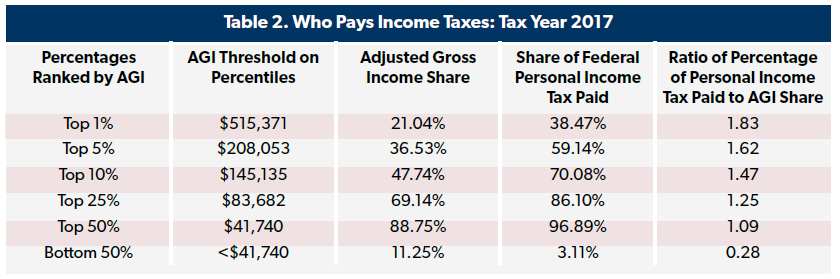
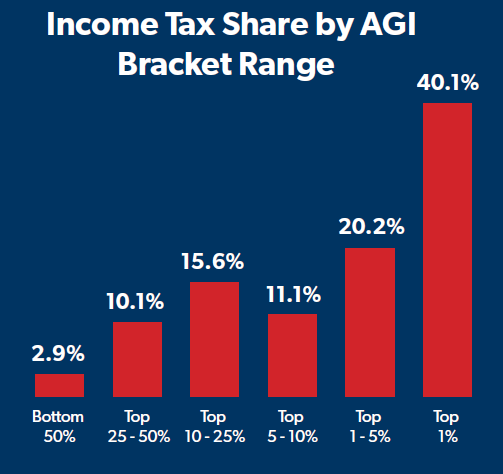
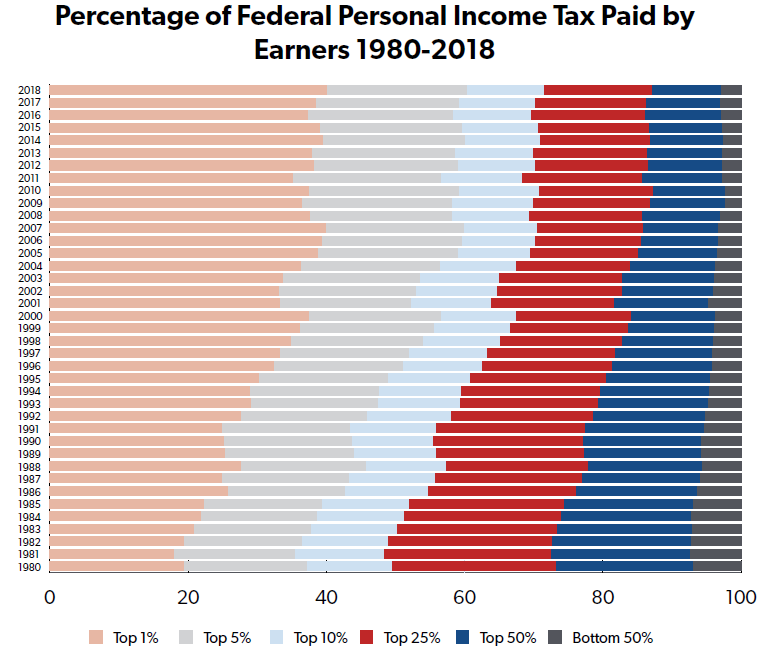
The new data shows that the top 1 percent of earners (with incomes over $540,009) paid over 40 percent of all income taxes. Despite the tax rate reductions associated with TCJA, this figure is up slightly from the previous tax year’s 38.5 percent share. In fact, NTUF has compiled historical IRS data tracking the distribution of the federal income tax burden back to 1980 and this is the highest share recorded over that period, topping 2007’s 39.8 percent income tax share for the top 1 percent. The amount of taxes paid in this percentile is nearly twice as much their adjusted gross income (AGI) share.
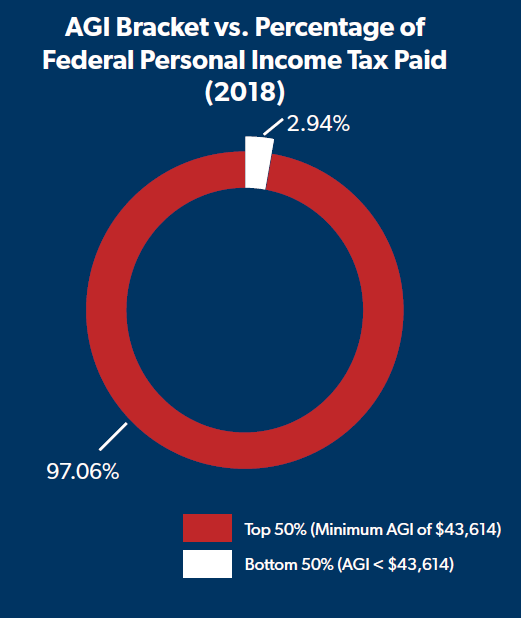
The top 10 percent of earners bore responsibility for over 71 percent of all income taxes paid and the top 25 percent paid 87 percent of all income taxes. Both of those figures represent an increased tax share compared to 2017. The top fifty percent of filers earned 88 percent of all income and were responsible for 97 percent of all income taxes paid in 2018.
The other half of earners (with incomes less than $43,614) took home 11.6 percent of total nation-wide income (a slight increase from 11.3 percent in 2017) and owed 2.9 percent of all income taxes in 2018, compared to 3.1 percent in 2017.
As NTUF reported earlier this year, the number of filers with no income tax liability increased from 2017 to 2018 to 34.7 percent.[2] The number of nontaxable returns is often related to the economy: as employment decreases and income falls, the number of filers facing no income taxes tends to increase, and vice versa. While 2018 saw a strong economy that would ordinarily increase the number of individuals with income tax burdens, the TCJA removed additional people from income tax rolls by increasing the standard deduction and expanding refundable credits.
Historical Comparison
As noted above, NTUF has compiled historical IRS data tracking the distribution of the federal income tax burden back to 1980. In that year, the income tax share of the top one percent of filers was 19 percent – less than half of what it is now (40 percent). This is despite the fact that the top marginal income tax rate was 70 percent in 1980 and has since fallen to 37 percent in 2018.[3]
On the other side of the income spectrum, the bottom 50 percent’s income tax burden has been significantly reduced over the past forty years. In 1980, it stood at 7 percent. That dropped to a low of 2.4 percent in 2010 during the recession. As the economy gradually improved after the recession, the tax share of this income group gradually increased to 3.1 percent in 2017. Although the economy remained strong in 2018, this group's tax share fell from the previous year. This can be attributable in part to the lower rates and higher standard deduction enacted in the TCJA along with its additional provisions designed to ease burdens low-income earners such as the increased child tax credit.
The trends are clear: the code has become increasingly progressive, and when people are allowed to keep more of their own money, they prosper, move up the economic ladder, and pay a bigger part of the income tax bill for those who aren’t.
Tax Cuts and Tax Fairness
Democratic party leaders have taken rhetorical shots against tax reform bill since it was introduced back in 2017. During the debate, Speaker of the House Nancy Pelosi (D-CA) went so far as to call the TCJA the “worst bill in the history of the United States Congress.”[4] Senate Minority Leader Chuck Schumer (D-NY) also disparaged the bill as a “product that no one can be proud of and everyone should be ashamed of.”[5]
Progressives continue to assail the TCJA in the years since its passage. A few days before the election, the Center for American Progress, a self-described “progressive” policy institute, called the tax system “unfair” and said the results of the TCJA were a “hugely regressive tax cut.”[6]
This ignores that most taxpayers paid less thanks to the TCJA. In fact, the Tax Policy Center estimated that nearly two-thirds of households paid less income taxes in 2018 than they would have under the pre-TCJA code, while 6 percent paid more (mostly due to the new cap on the state and local tax deduction impacting residents of high-tax states).[7]
With the income tax burden concentrated largely among a small percentage of filers, the total dollar value of tax reductions is naturally highest among those with very high incomes paying high effective rates, but the benefits are felt across income levels. A reputable dynamic analysis from the Tax Foundation shows that tax reductions as a percentage of income ranged between 2.0 and 2.8 percent for each of the five income quintiles by the end of a 10-year scoring window (assuming that the individual provisions are extended beyond their scheduled expiration after 2025).[8] While the top quintile does see the largest reduction, all quintiles benefit from the economic growth spurred by the TCJA and its tax reductions. The second largest comes in the lowest quintile, where tax burdens were already very low. This illustrates the broad-based nature of TCJA’s benefits.
Low-income households having very little tax burden to cut in the first place, in dollar terms, is also why “tax cut” proposals targeted at lower-income households rely heavily on “refundable credits.” Like other tax credits, these reduce a filer’s income tax liability. But unlike nonrefundable credits, any remaining credits are paid to the filer. The refundable portion manifests as direct spending through the tax code.
Lower tax rates allow Americans to keep more of their earned income, whereas refundable tax credits provide subsidies. For example, the IRS reports that filers claimed $109.4 billion in refundable credits in 2018.[9] Of this amount, $4 billion was applied toward reducing income tax burdens and $10.9 billion against other federal taxes. The remaining $94.6 billion ($10 billion higher than in 2017) was essentially converted into subsidy checks. Nearly 96 percent of the refundable credit portions were from two credits: the Earned Income Credit ($56.2 billion, down slightly from $56.8 billion in 2017) and the Additional Child Tax Credit (34.2 billion – an increase of 46.8 percent from 2017).
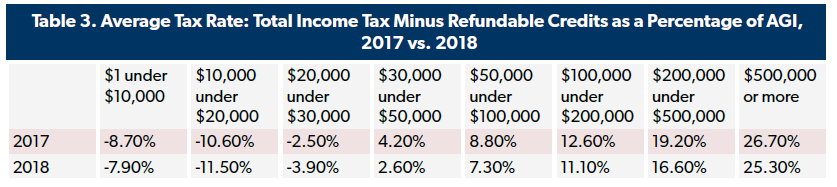
The IRS 2018 data shows that filers with AGI under $30,000 had an average income tax rate that was negative, thanks to the refundable credits. As filers’ income increases, the average tax generally increases. Those in a range from below to just above the income of the middle-class, with AGIs in from $50,000 to $200,000, paid an average income tax rate of 9.3 percent.[10] The top one percent (incomes above $540,009) paid an average income tax rate of nearly 27 percent.
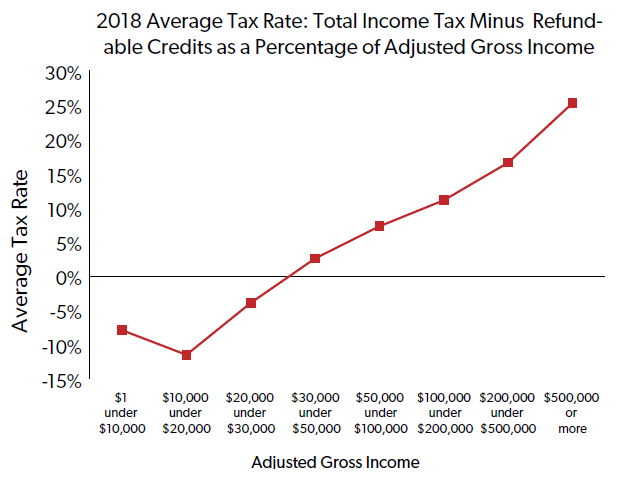
Compared to 2017, the data shows that those earning from $1 to $10,000 received, on average, fewer refundable credit subsidies, but otherwise taxpayers up and down the income groups either paid lower average tax rates, or saw increased negative tax rates.
These attacks on not just the TCJA but any tax reduction are used to justify tax increases. As a presidential candidate, Joe Biden released a tax plan that would increase the top rate back to 39.6 percent and hike corporate tax rates, capital gains and payroll taxes. Other Democrats like Rep. Alexandria Ocasio-Cortez (D-NY) advocate for top income tax rates of 70 percent or more and Sen. Elizabeth Warren (D-MA) and Sen. Bernie Sanders (I-VT) introducing steep new wealth taxes as well.
Tax hikes would be a threat to the economic recovery. The Tax Foundation projects that Biden’s tax plan would reduce GDP and lead to about a 1.9 percent decline in after-tax income for all taxpayers on average.[11] Wealth taxes would impose immense compliance and administrative burdens on an already complicated tax system. Wealth taxes would also negatively impact private charitable foundations and entrepreneurs.
Conclusion
The distribution of the tax burden is an important issue impacting the debate surrounding fiscal and economic policies as the new Congress convenes next January. When looking at the income tax alone, the federal government’s largest source of revenue, data from the IRS shows that America’s code remains very progressive. Lower-income households face negative tax burdens, with effective rates rising steadily as income increases.
Despite heated political rhetoric suggesting that the 2017 Tax Cuts and Jobs Act was a regressive plan that accrued primarily to the benefit of the wealthy, this new IRS data makes clear that it was in fact a significant overall reduction in tax burdens that in fact made the code more progressive, not less. Congress would be wise to remember that when discussing future tax reform efforts.
[1] Internal Revenue Service (2020). SOI Tax Stats - Individual Income Tax Rates and Tax Shares. Retrieved from https://www.irs.gov/statistics/soi-tax-stats-individual-income-tax-rates-and-tax-shares.
[2] Brady, Demian. Who Doesn't Pay Income Taxes? Tax Year 2018, National Taxpayers Union Foundation. October 14, 2020. Retrieved from https://www.ntu.org/foundation/detail/who-doesnt-pay-income-taxes-tax-year-2018.
[3] National Taxpayers Union Foundation. (2020). How Have the Top and Bottom Income Tax Brackets Changed Over Time? Retrieved from https://www.ntu.org/foundation/tax-page/how-have-the-top-and-bottom-income-tax-brackets-changed-over-time.
[4] Marcos, Cristina. “Pelosi: GOP tax proposal 'the worst bill in the history' of Congress.” The Hill. December 4, 2017. Retrieved from https://thehill.com/blogs/floor-action/house/363240-pelosi-gop-tax-proposal-the-worst-bill-in-the-history-of-the-united.
[5] The Senate Democratic Caucus. (2017). Schumer Statement on GOP Tax Bill. Retrieved from https://www.democrats.senate.gov/newsroom/press-releases/schumer-statement-on-gop-tax-bill.
[6] Hendricks, Galen, “6 Ways the Trump Administration Is Rigging an Already Unfair Tax Code.” Center for American Progress. October 28, 2020. Retrieved from https://www.americanprogress.org/issues/economy/news/2020/10/28/492473/6-ways-trump-administration-rigging-already-unfair-tax-code/.
[7] Gleckman, Howard. “A Last Look At The 2019 Filing Season.” Tax Policy Center, April 25, 2019. Retrieved from https://www.taxpolicycenter.org/taxvox/last-look-2019-filing-season.
[8] Tax Foundation. (2017). Preliminary Details and Analysis of the Tax Cuts and Jobs Act. Retrieved from https://taxfoundation.org/final-tax-cuts-and-jobs-act-details-analysis/.
[9] Internal Revenue Service. (2020). Individual Income Tax Returns Complete Report: 2018. Retrieved from https://www.irs.gov/statistics/soi-tax-stats-individual-income-tax-returns-publication-1304-complete-report.
[10] “What is Middle Class, Anyway?” CNN. Retrieved from https://money.cnn.com/infographic/economy/what-is-middle-class-anyway/index.html.
[11] Watson, Garrett et al. Details and Analysis of Democratic Presidential Nominee Joe Biden’s Tax Plan. Tax Foundation, October 22, 2020. Retrieved from https://taxfoundation.org/joe-biden-tax-plan-2020/.