
(pdf)
The latest tranche of tax migration data from the IRS provides the first glimpse into how taxpayers’ residency decisions have changed during the pandemic. Covering the change between returns filed in 2020 and 2021, the data effectively shows which states taxpayers chose to use their newfound freedom to move to — and away from.
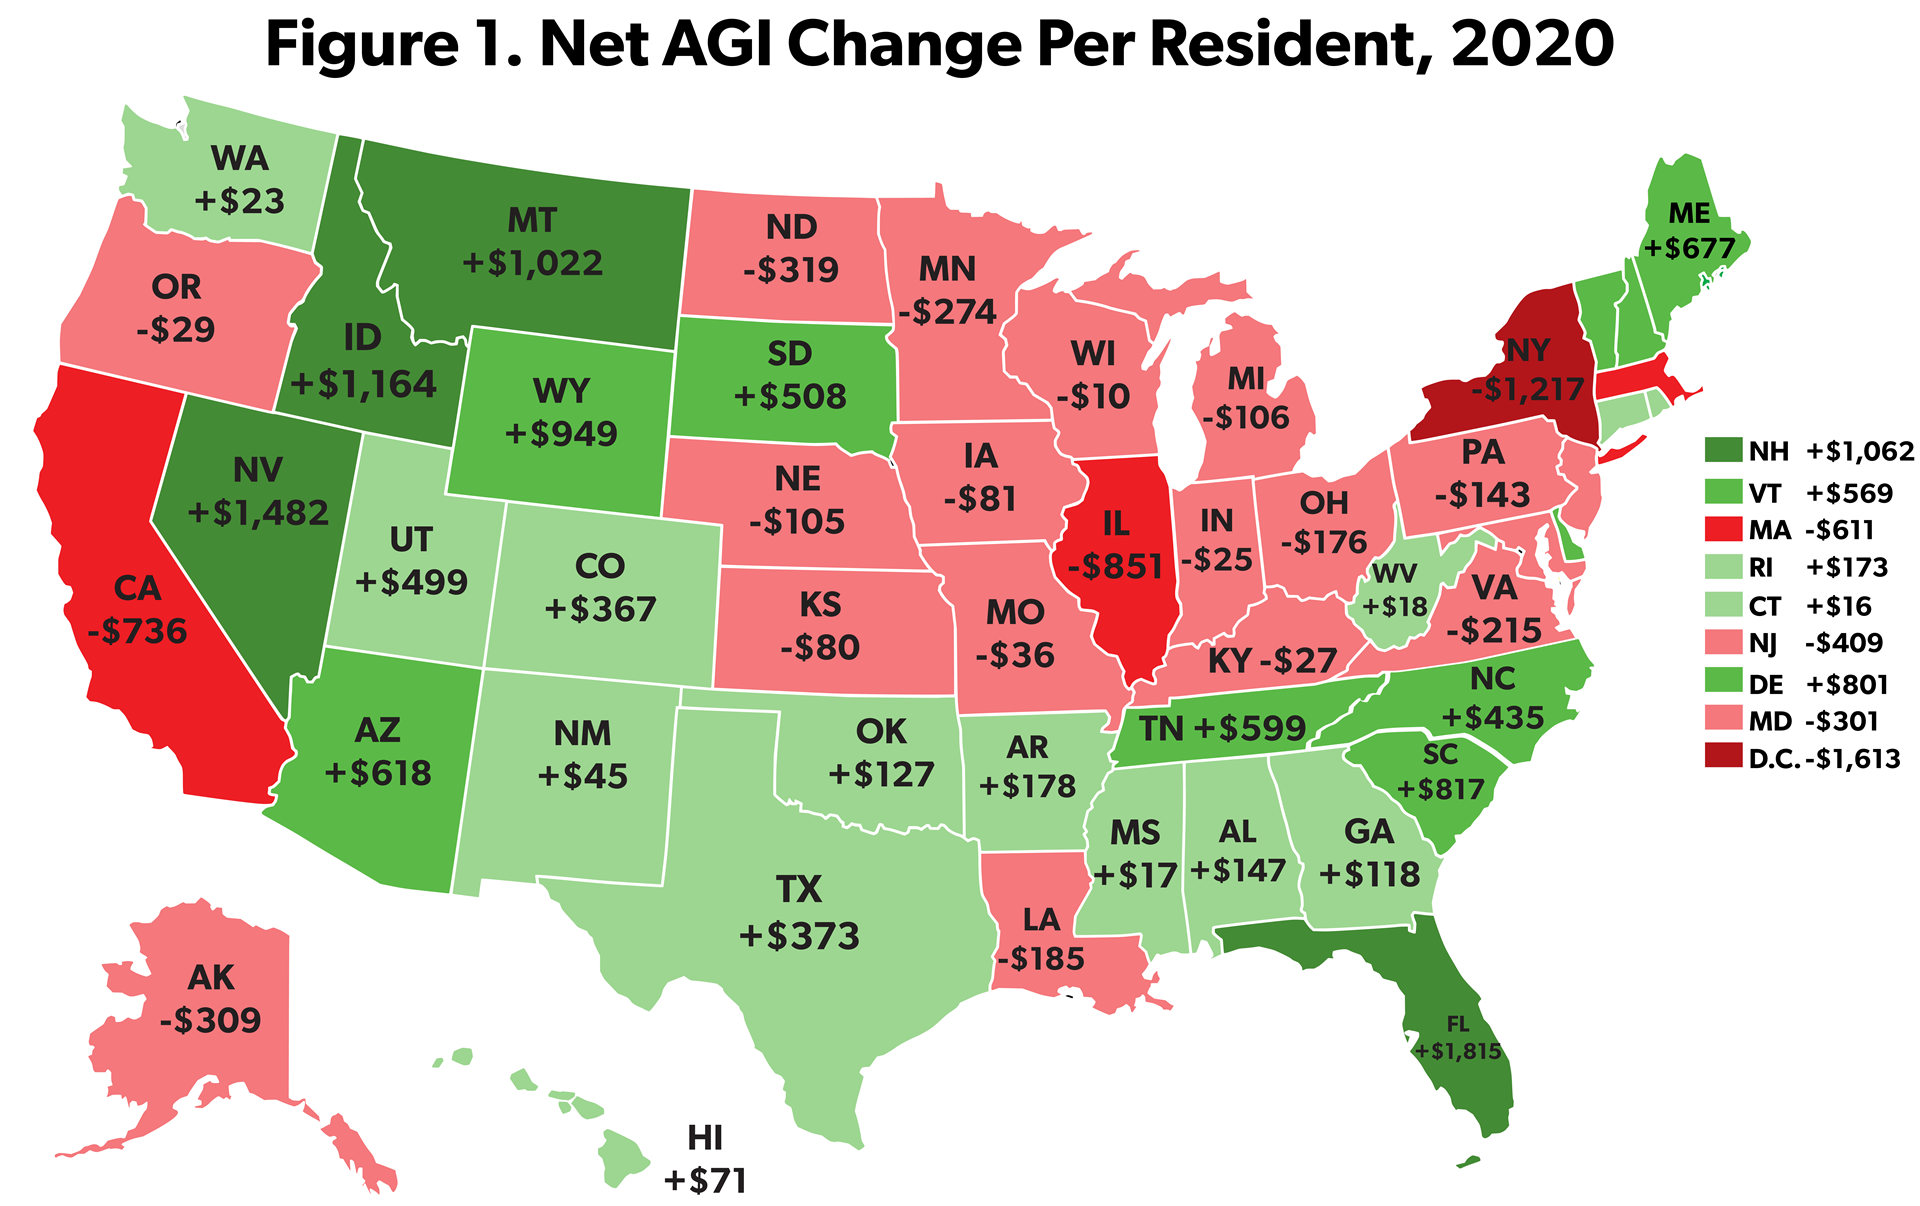
This data shows a clear pattern of taxpayers fleeing high-tax states and heading towards lower-tax states. Seven of the ten biggest net loss states from tax migration in terms of Adjusted Gross Income (AGI) were among the states with the highest taxes (California, Illinois, Maryland, Minnesota, New Jersey, New York, and Virginia), while all ten assessed tax burdens above the national median. Similarly, all but one of the biggest net gain states from tax migration in terms of AGI assessed state-local tax burdens below the national median (Arizona, Colorado, Florida, Idaho, Nevada, North Carolina, South Carolina, Tennessee, and Texas).
These trends are interesting for their own sake, but they come together in a common theme of increased post-pandemic taxpayer agency. Taxpayers have always factored state and local tax rates into their residency decisions, but in the past their ability to consider these factors has been limited. After all, they still needed to live where they could find work. That meant that the states playing host to these “job hubs” could often get away with ever-increasing tax burdens. Pandemic-induced remote work could mark a major turning point in that phenomenon. No longer anchored to a specific worksite, taxpayers have a great deal more freedom in where they live.
While fully-remote workers have their pick of the litter when it comes to which state’s tax burdens they want to be subjected to, even workers who have switched to working from home three or four days a week have a lot more flexibility — able to live much further from their worksites than they once did now that a daily commute is no longer a requirement. Mobile workers who travel from one job to another are becoming more common in an increasingly digitized, remote economy. These taxpayers can choose what states they want to work in, and tax policy often plays a factor in those decisions. Data has illustrated the outflow of taxpayers from expensive cities and the increasing prevalence of remote work, and while these trends have moderated somewhat, they remain much more prevalent than before the pandemic.
It’s worth noting that while the biggest tax migration “losers” should respond to this information by trying to make their tax codes more competitive, many have already shown that they prefer a different path. States have shown increasing interest in reaching across state borders to tax nonresidents in recent years, in part because it allows them to nullify taxpayers’ residency decisions. Failure to rein in these efforts will squander a one-of-a-kind opportunity to let taxpayers make their voices heard.
High Tax States Lose Net Population and Income, Low Tax States Gain Net Population and Income
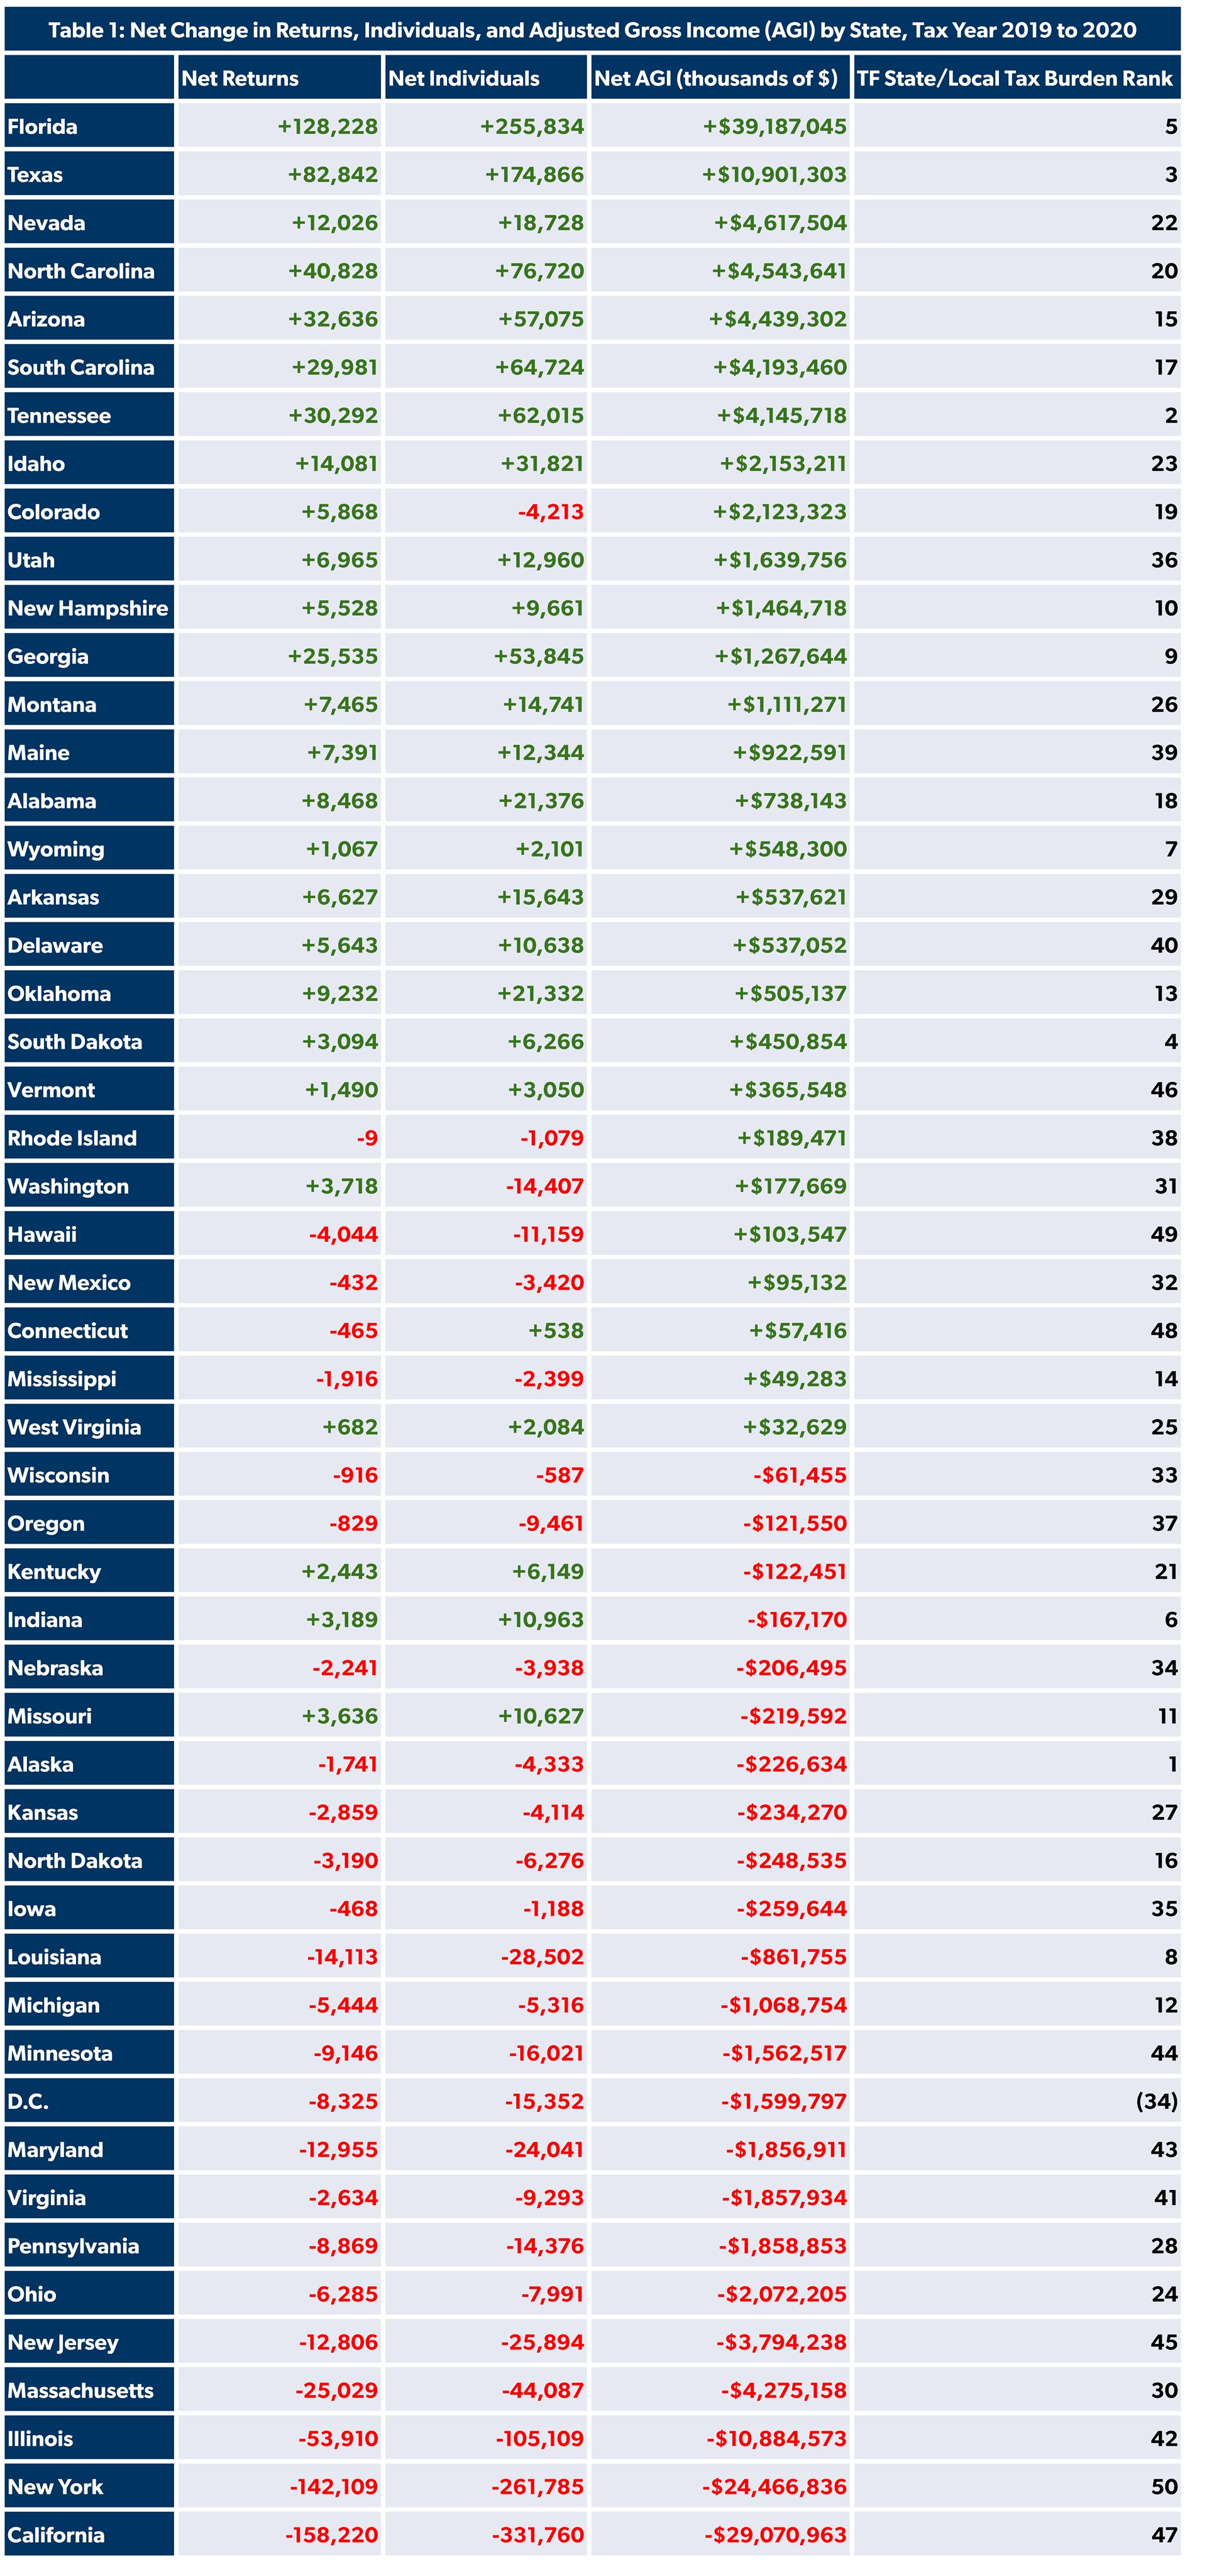
Table 1 shows how taxpayers voted with their feet at an accelerated rate in tax year 2020,1 including each state’s rank on the 2020 version of Tax Foundation’s State-Local Tax Burden rankings, where #1 is low-tax and #50 is high-tax.
Table 1: Net Change in Returns, Individuals, and Adjusted Gross Income (AGI) by State, Tax Year 2019 to 2020
It is also clear that high-tax states disproportionately lose wealthier taxpayers. Table 2 shows the average household leaving each state, household migration to each state, and the difference between the two.
Table 2: Average AGI Per Household Entering/Leaving Each State
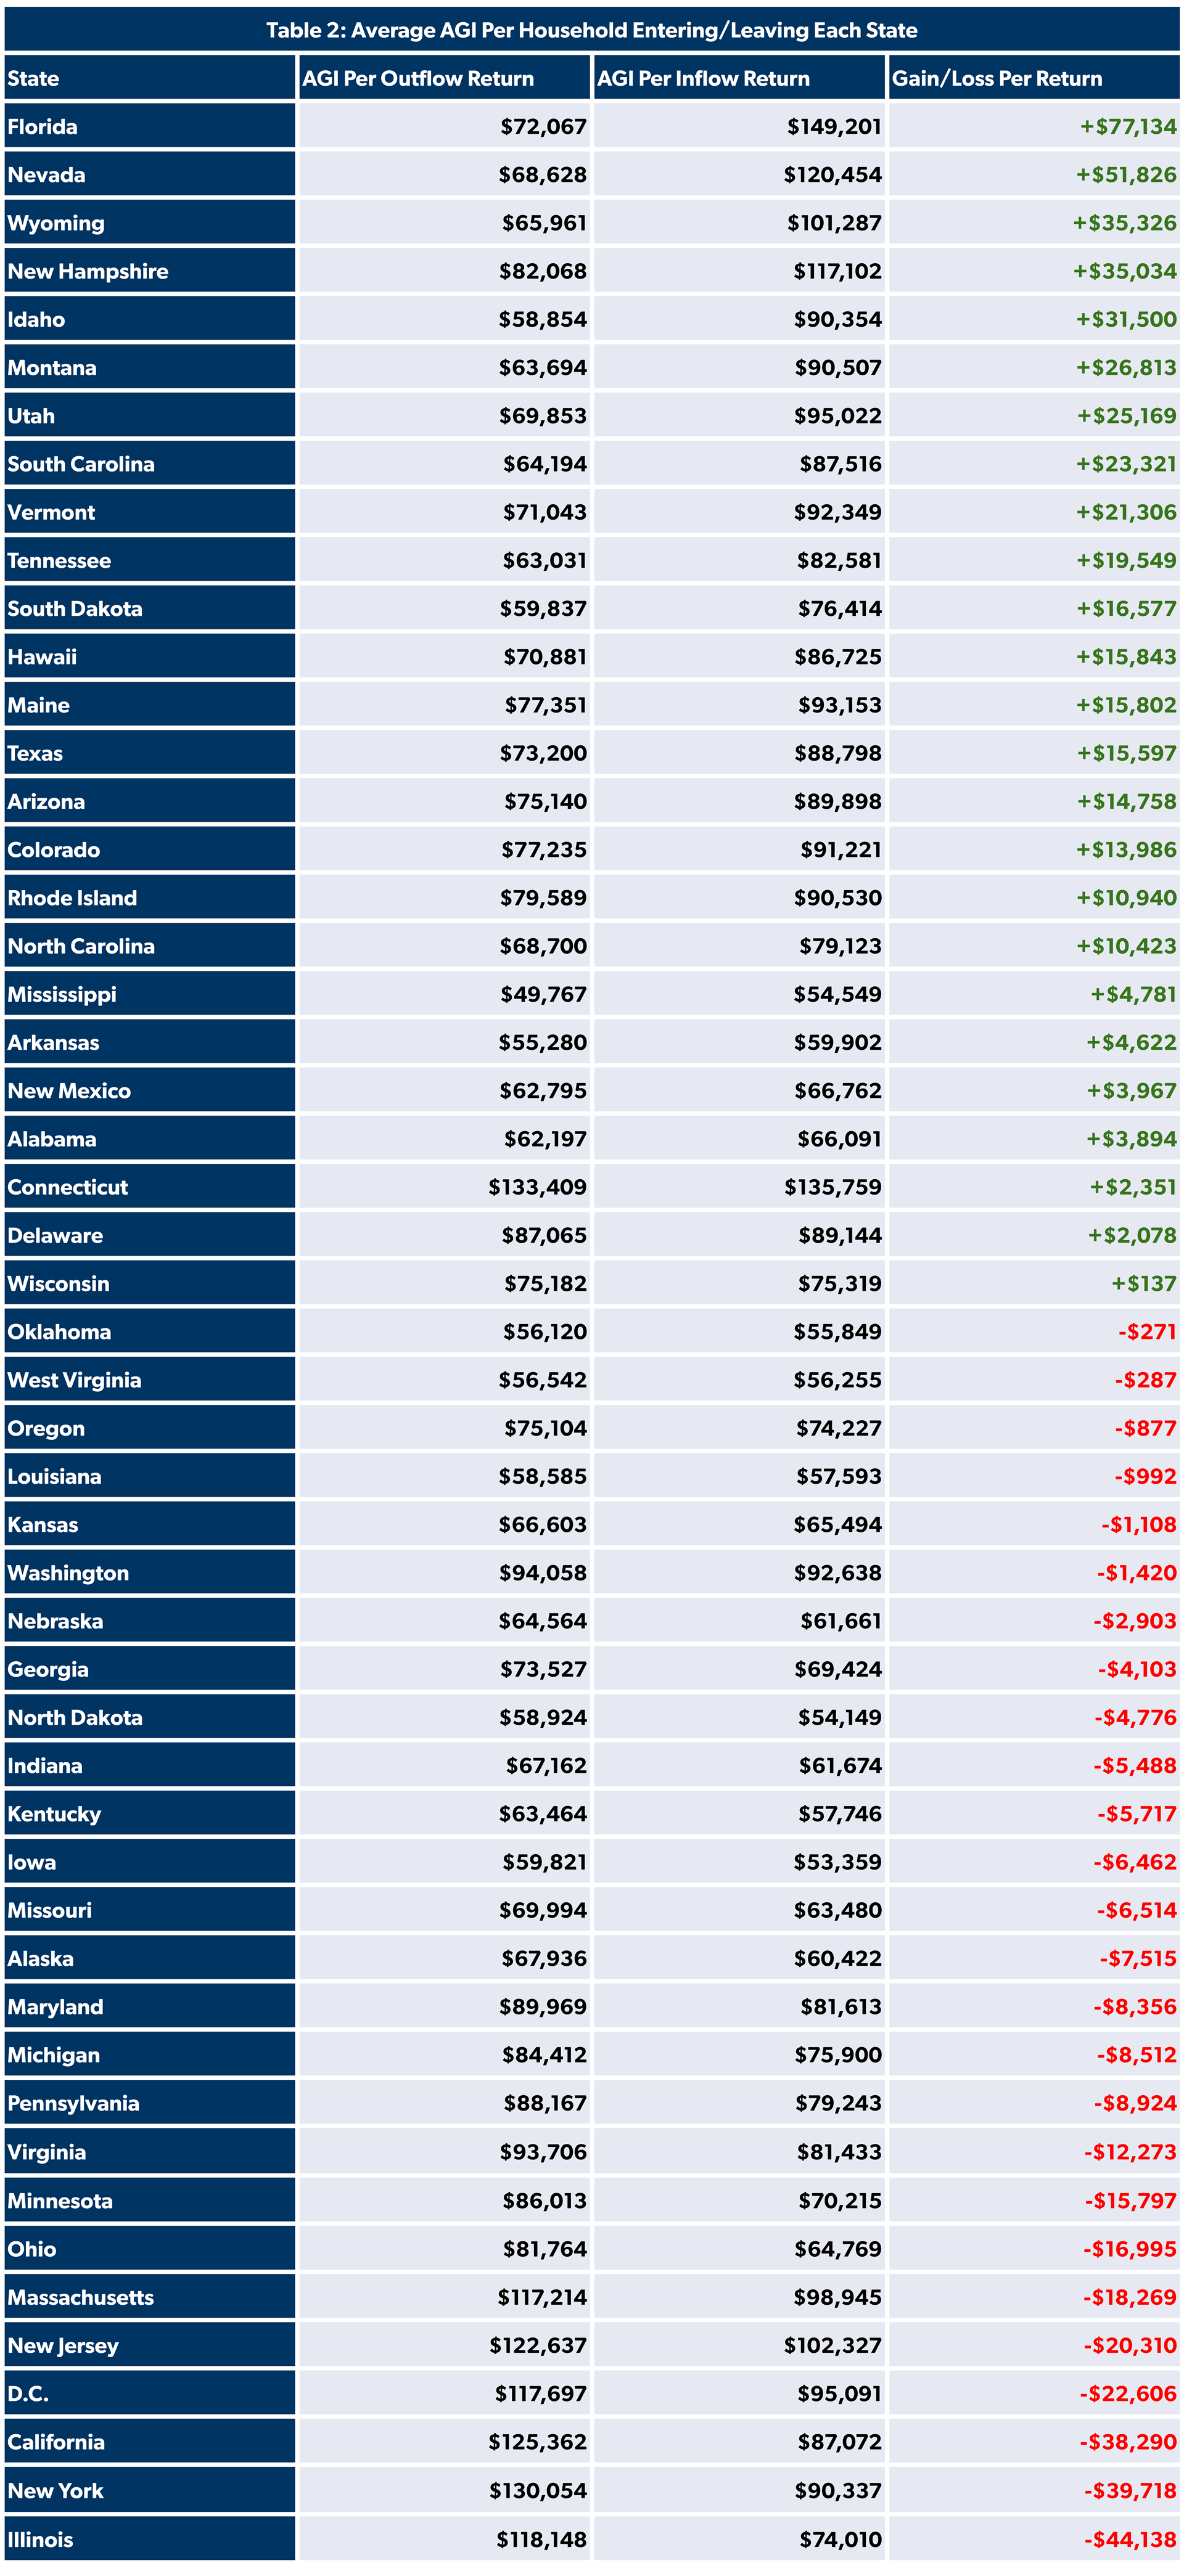
While to some extent this is a natural consequence of the difference in median income in these states, the average taxpayer leaving high-tax states still generally earns more than the median taxpayer. For instance, the median household income in 2020 was at least $25,000 lower than the average outflow return in each of the bottom five states in Table 2 — and in New York’s case, over $50,000 lower.
Population-Adjusted Numbers
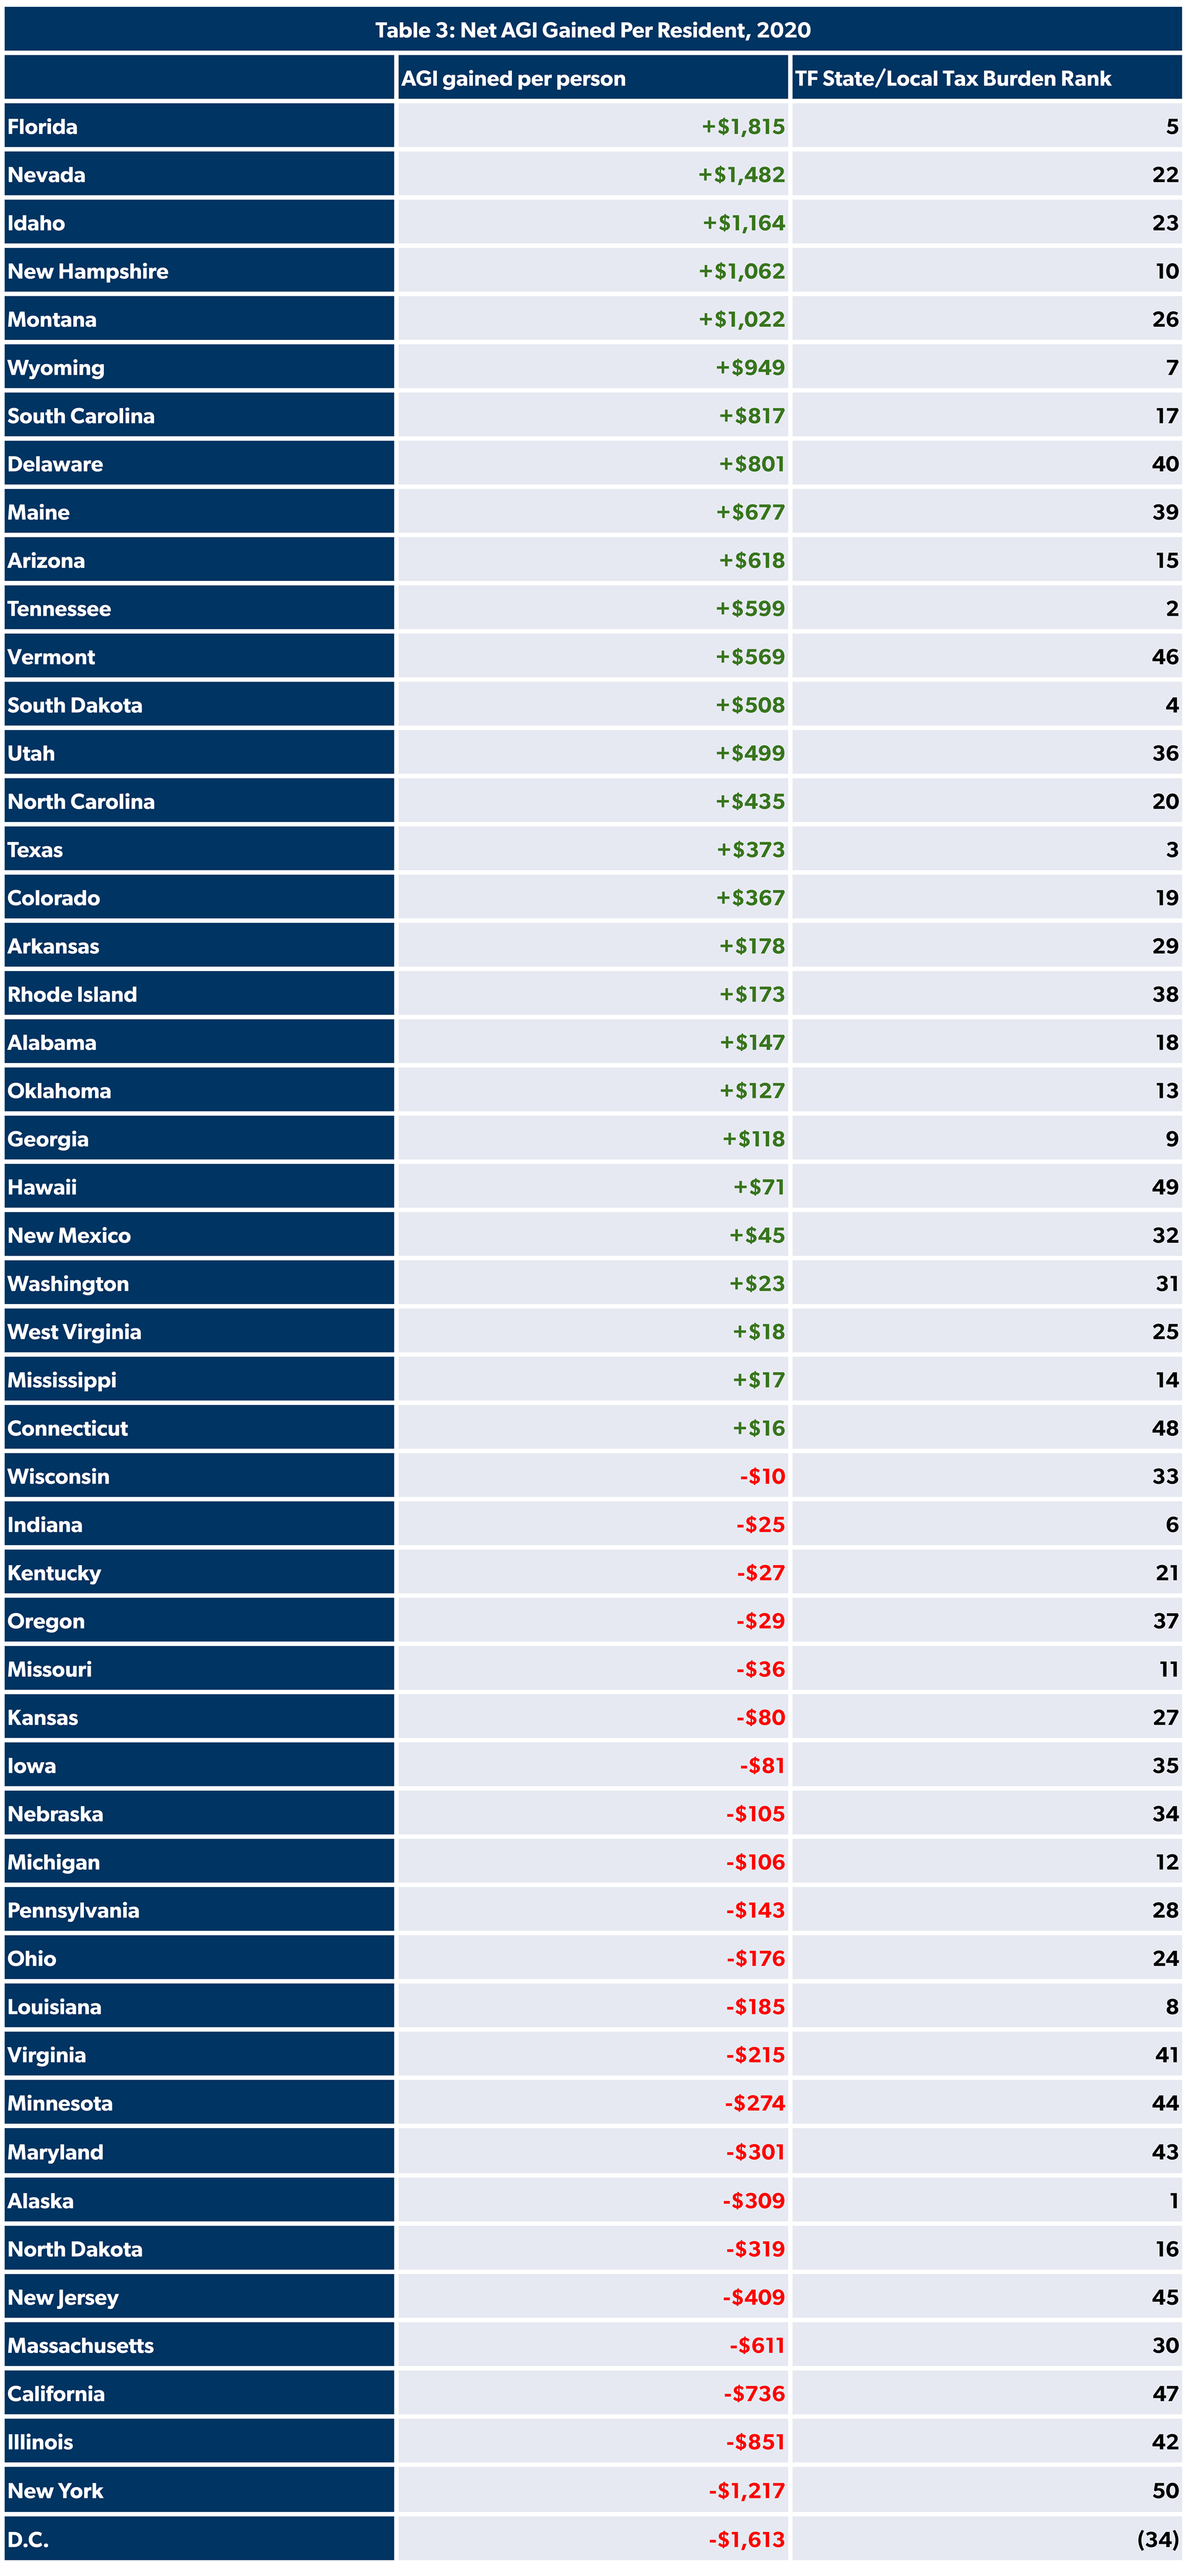
The states with the most drastic changes from tax migration are also the most populous. While the gross numbers still matter a great deal, adjusting tax migration figures for inflation gives more of a proportional picture of tax migration changes. Table 3 shows the amount of AGI per person each state gained and lost from tax migration.
Even taking into account its large population, Florida still gains the most from tax migration. Most of the biggest proportional winners from tax migration had average or above-average rankings on Tax Foundation’s State Local Tax Burdens index in 2020. The two exceptions, Delaware and Maine, are situated in the Northeast, a generally high-tax region. The biggest net loss states are a reshuffled version of the top five net migration loss states generally, showing that the results are not merely a function of those states’ large populations.
The clear exception to the general rule that high-tax states lose taxpayers while low-tax states gain them is Alaska, which loses the seventh-most AGI per resident despite having the lowest tax burden in the country. That can mostly likely be attributed to Alaska’s high cost of living and remote location.
Table 3: Net AGI Gained Per Person, 2020
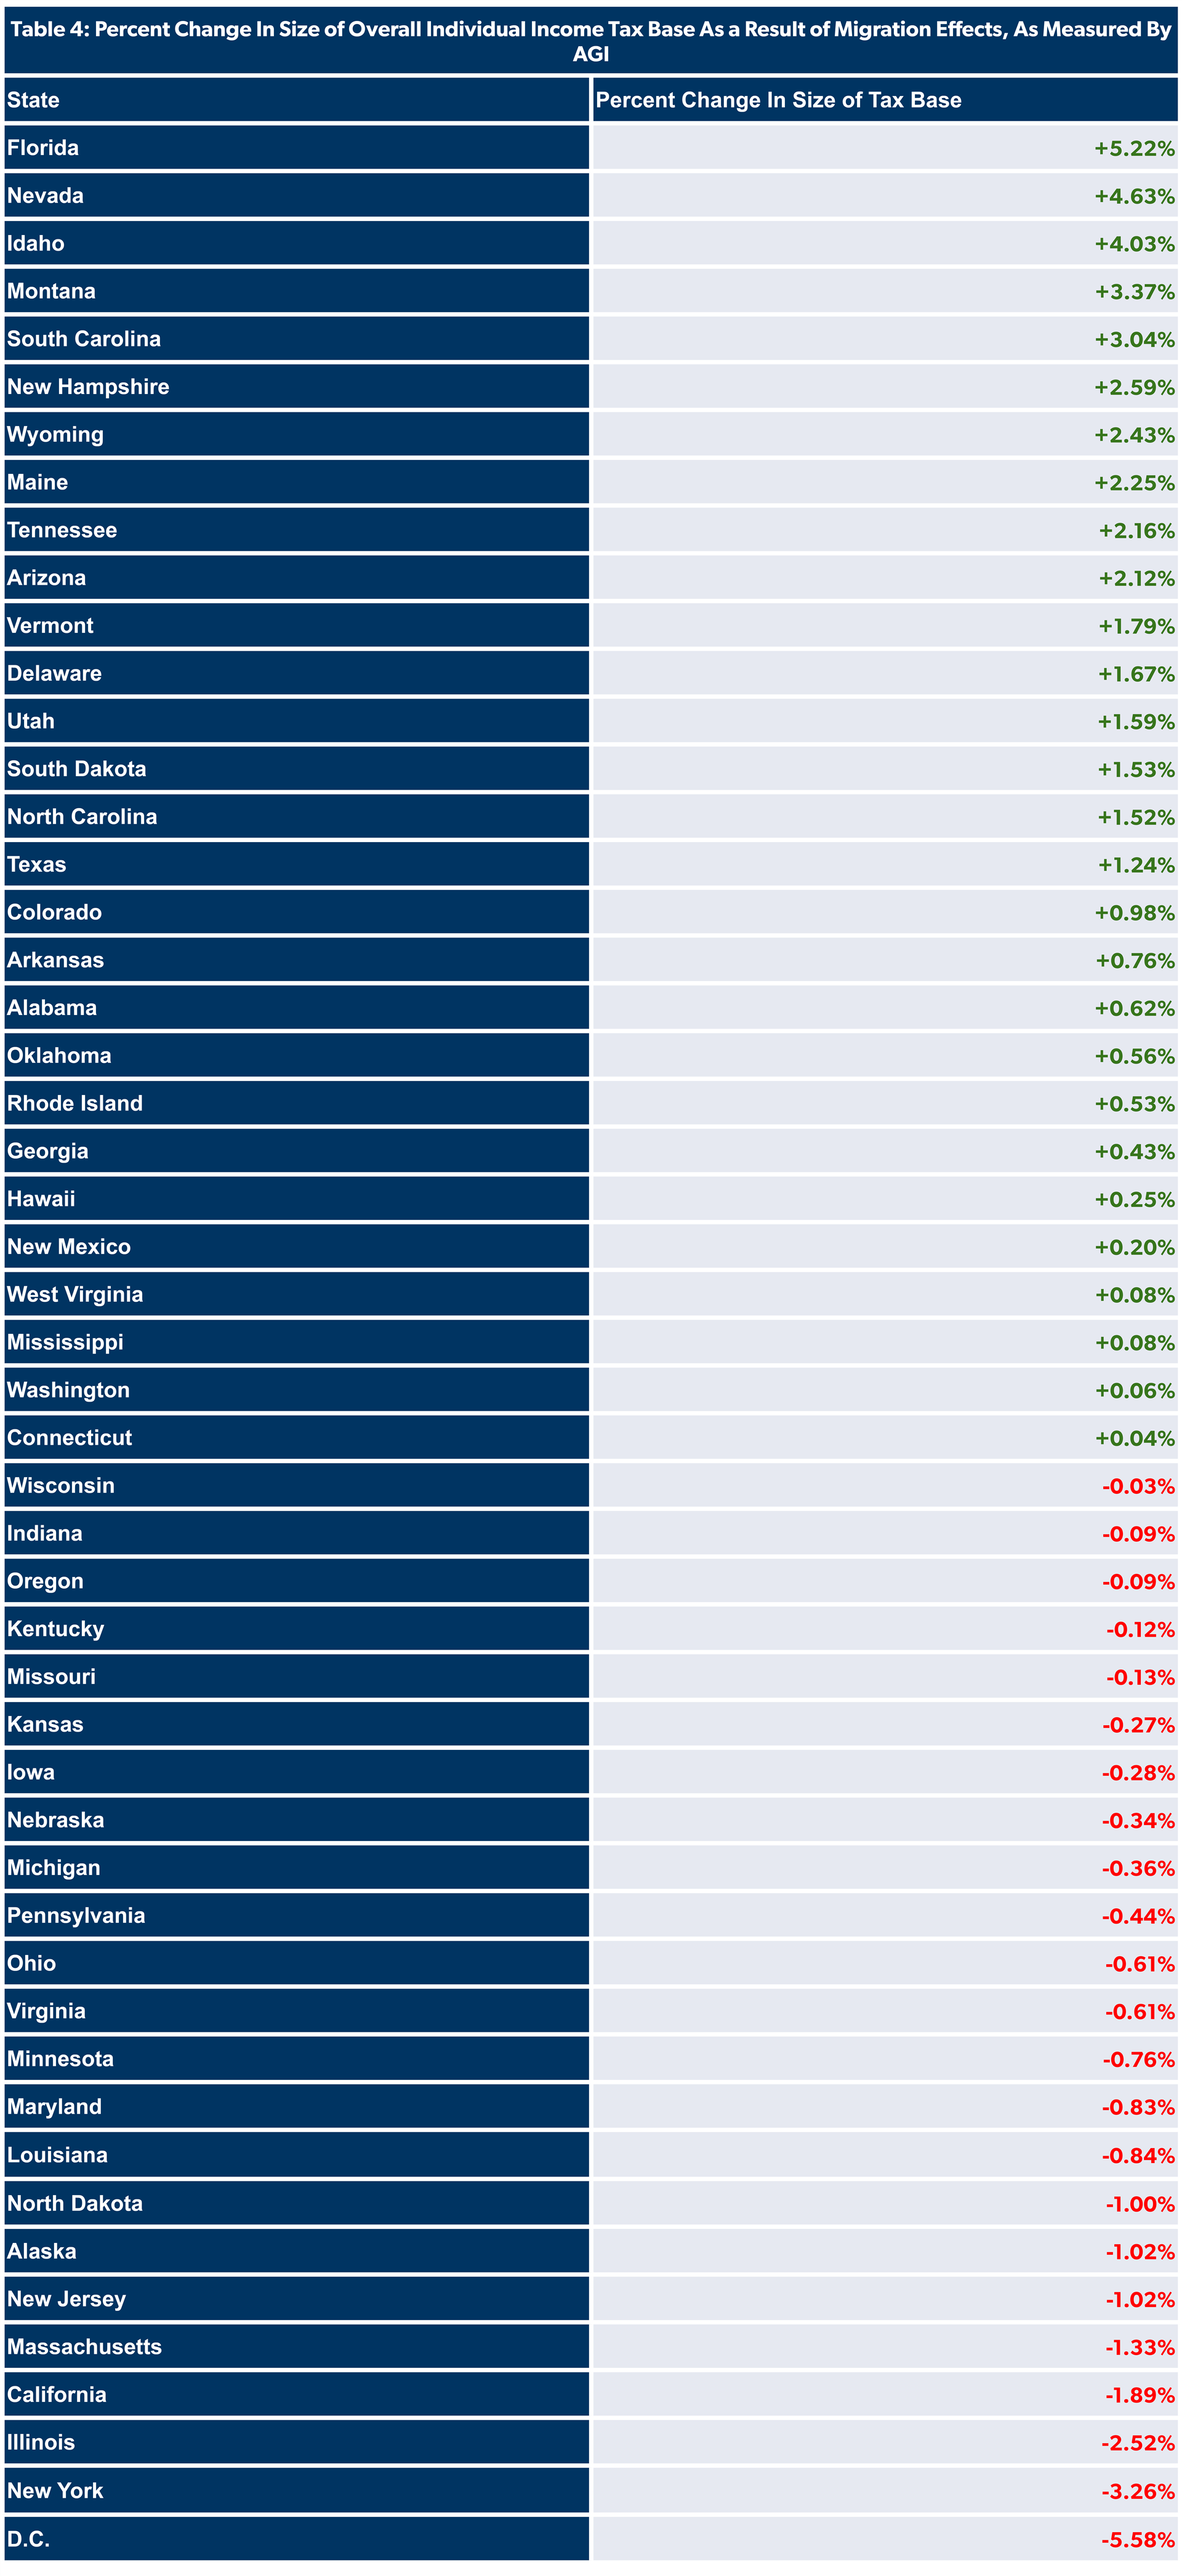
Perhaps even more important to states is how their tax bases are affected by tax migration. Table 4 shows the percent change in size of states’ individual income tax base before and after factoring in migration effects, as measured by AGI (whether or not the state chooses to levy such a tax).
Table 4: Percent Change In Size of Overall Individual Income Tax Base As a Result of Migration Effects, As Measured By AGI
An Accelerating Trend: Taxpayers Flee States With High Tax Burdens
In our last report on tax migration data, covering state residency changes from tax years 2018 and 2019, we also found a net shift from high-tax states to low-tax states. The top ten net migration loss states were all states that ranked in the bottom half of the Tax Foundation’s 2019 state-local tax burdens rankings, while the top ten tax net migration gain states all ranked in the top half.
The rate at which the tax migration losers lost taxpayers — and, conversely, the rate at which tax migration winners gained taxpayers — accelerated. California went from losing a net $8.8 billion in AGI in 2018 to losing a net $29.1 billion in 2020. In total, the ten biggest tax migration net loss states lost nearly $24 billion in AGI and 65,000 households more in 2020 than in 2019.
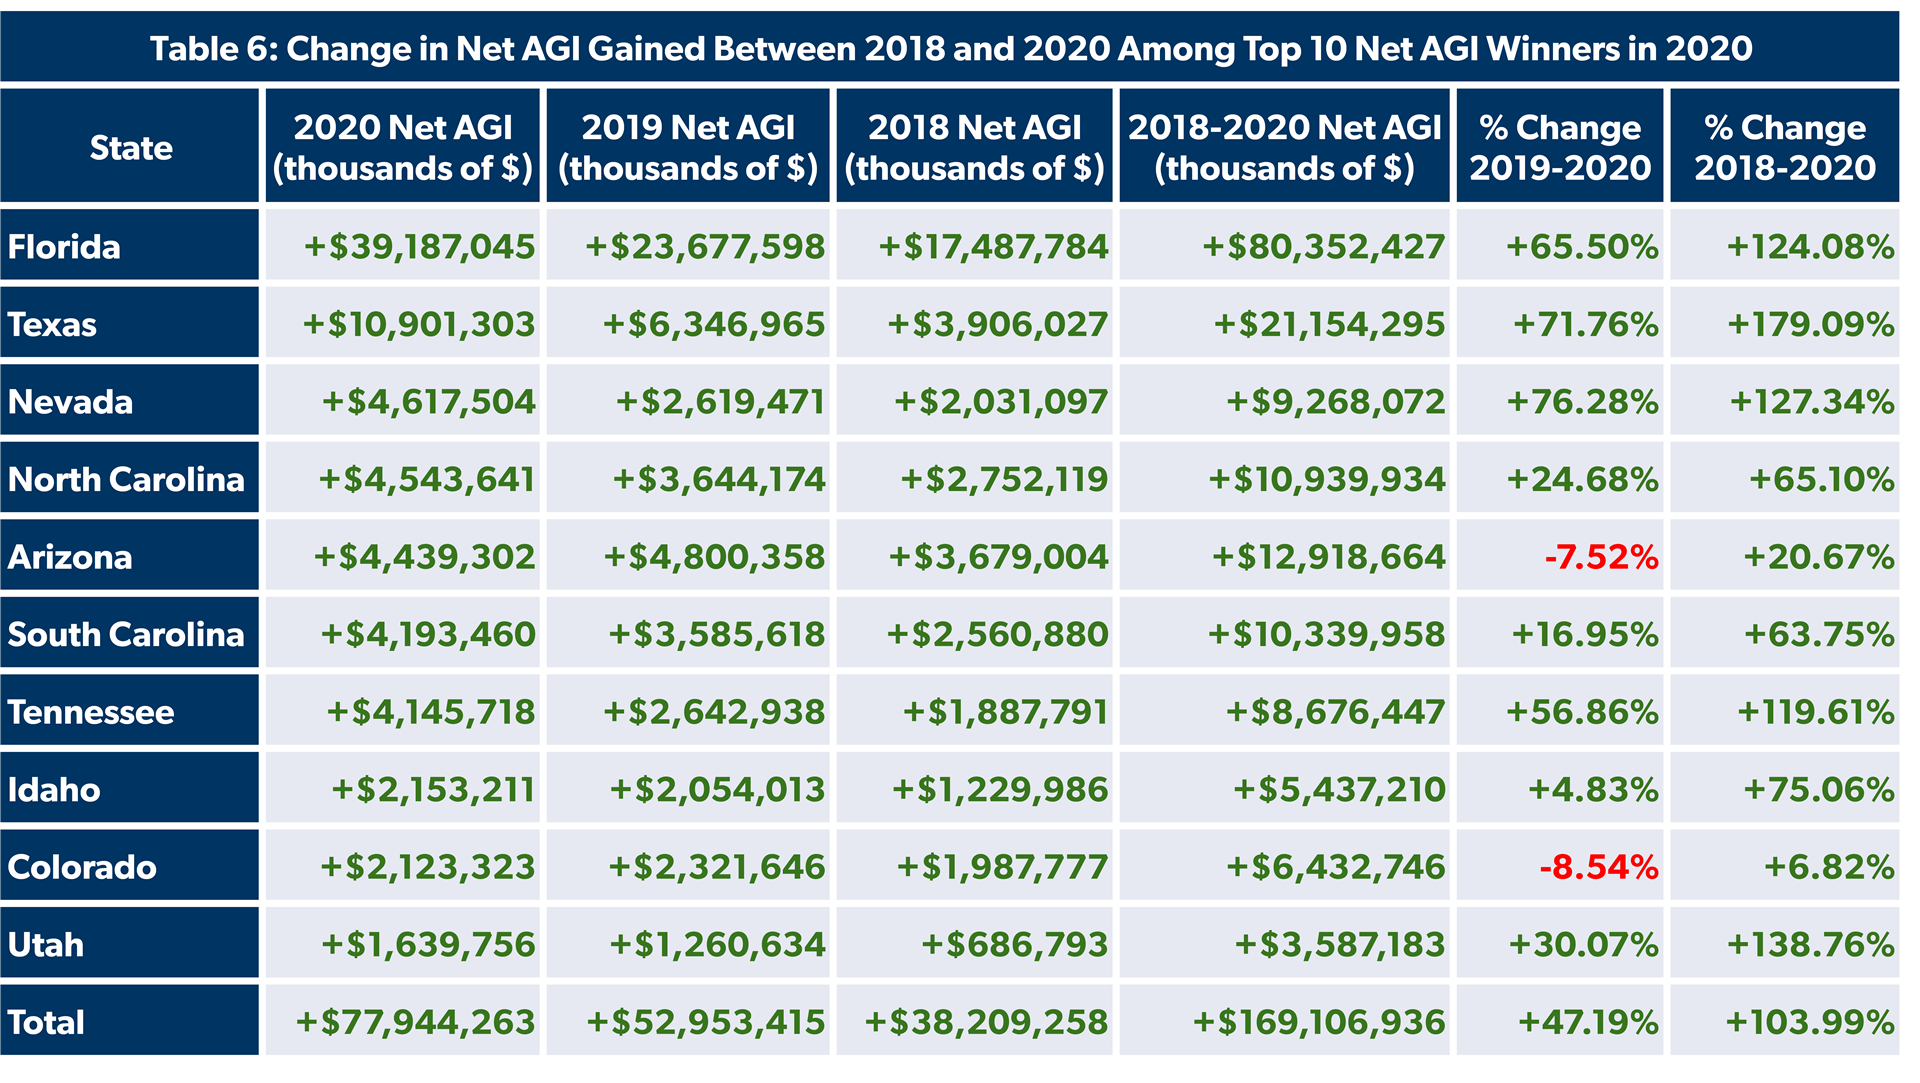
On the other hand, Florida remains the clear tax migration winner, gaining more AGI from tax migration than the next nine net gain states combined. While Florida has long been by far the biggest beneficiary of tax migration, its advantage became more pronounced in 2020. The ten biggest tax migration net gain states gained nearly $25 billion and 63,000 households more in 2020 than in 2019.
Looking back over the past three years of data, from 2018 to 2020, the acceleration of this trend becomes even more pronounced. In 2020, states like California, New York, and Massachusetts nearly tripled the amount of net AGI lost to tax migration just since 2018, while Florida, Texas, and Nevada all more than doubled their net AGI gain. The ten biggest tax migration net loss states in 2020 have lost nearly $175 billion from their tax bases between 2018 and 2020, with more than $100 billion of that amount lost by New York and California alone. The ten biggest tax migration net gain states have gained $169 billion between 2018 and 2020, nearly half of which was gained by Florida alone.
Table 5: Change in Net AGI Lost Between 2018 and 2020 Among Top 10 Net AGI Losers in 2020
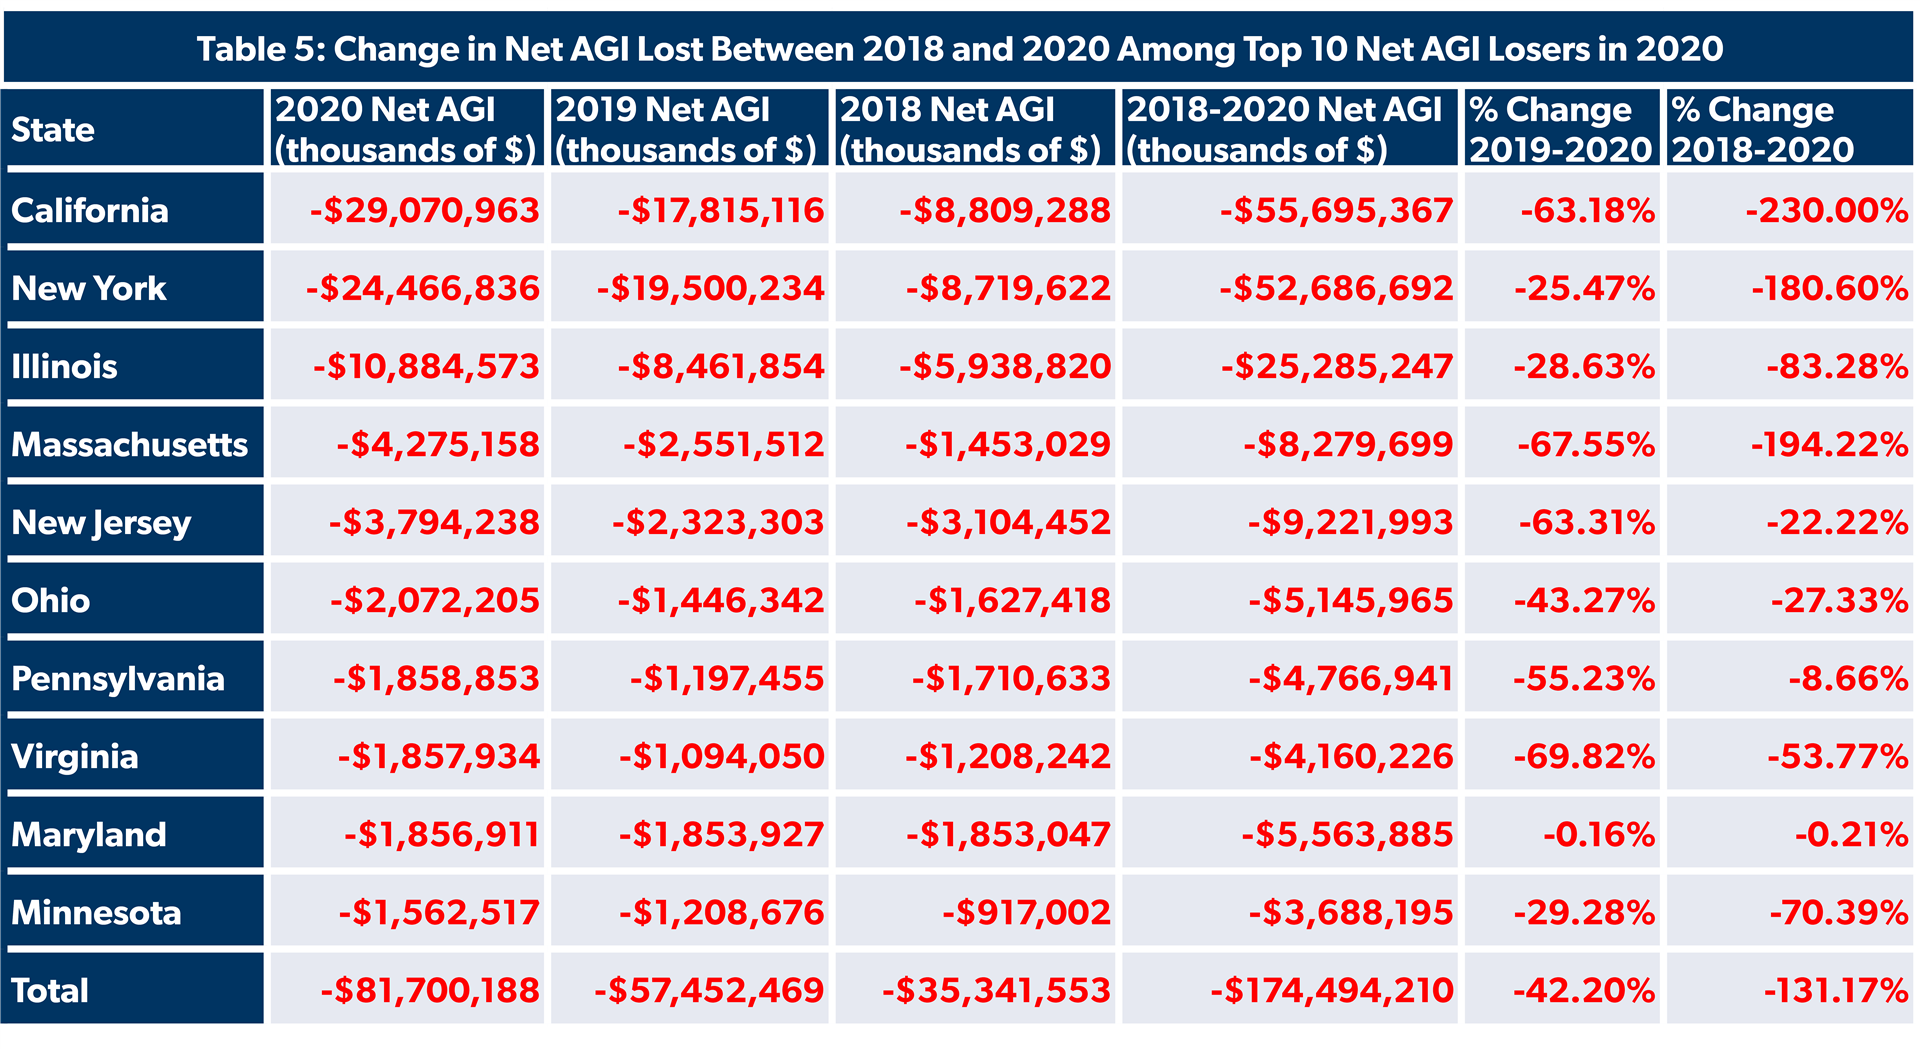
Table 6: Change in Net AGI Gained Between 2018 and 2020 Among Top 10 Net AGI Winners in 2020
Most-Fled States
While net migration is the most telling indicator of where taxpayers and their dollars are flowing, it is also interesting to see what states taxpayers are leaving. In our metric of Most-Fled States (Table 7), we compare out-migration not to in-migration, but to taxpayers who stayed. In other words, we look at the states with the highest — and lowest — proportions of taxpayers leaving each state during 2020.
Table 7: Outflow Percentages by State
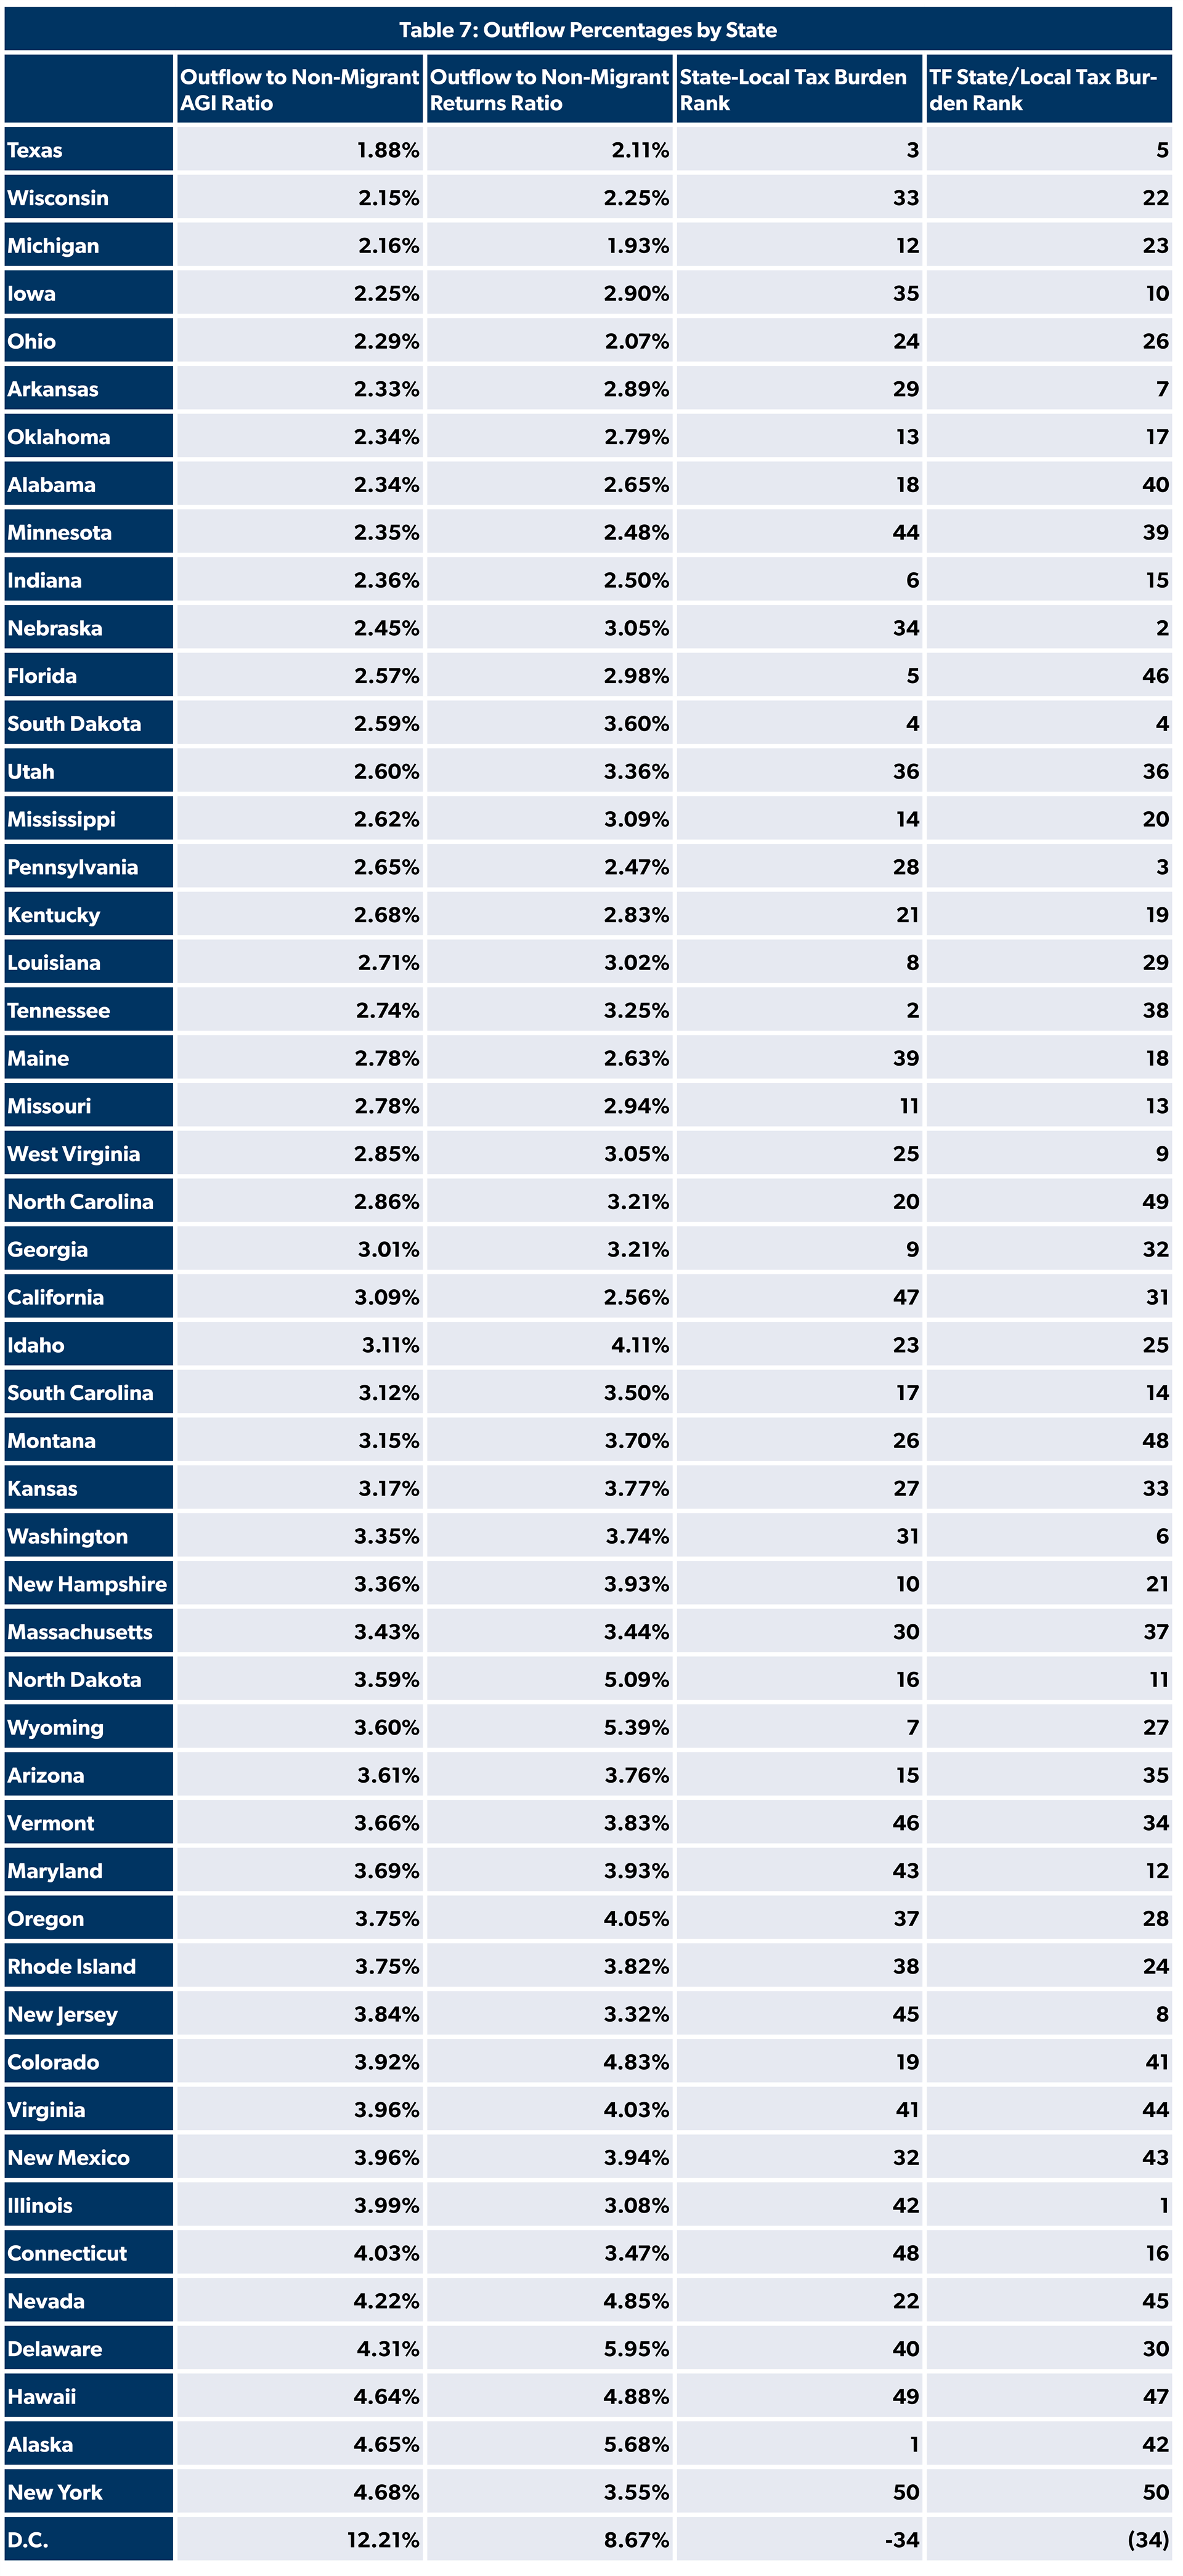
Once again, Alaska remains the clear aberration, seeing the second-highest proportional rate of out-migration despite boasting the lowest state-local tax burden. The reasons for this are likely the same as above — high cost of living, and Americans moving back to the contiguous states. Hawaii, the other non-contiguous state, comes in next.
Other states with high outflow are among the highest-tax states in the country. The top three states with the highest state-local tax burdens — New York, Hawaii, and Connecticut all appear, as do other high-tax states like Illinois and Virginia. D.C. easily has the highest outflow percentage: 8.67 percent for returns and a staggering 12.21 percent for AGI. However, the flight from cities during the pandemic has been well-documented, so D.C.’s out-migration numbers are not altogether surprising.
The phrase “Don’t Mess With Texas” apparently applies to trying to steal away its residents, as Texas AGI left the state at easily the lowest rate of any state in the nation. This is one category that Florida does not manage to appear in the top ten in (though it does have the 12th-lowest AGI outflow percentage.
Is it Just Taxes?
Even with newfound freedom of movement, there are still many reasons why taxpayers choose to move. Work, family, weather, or any number of other factors can take precedence over taxes in relocation decisions.
That being said, it’s notable that so many moves appear to be tax-driven. Again using Tax Foundation’s State-Local Tax Burden rankings, NTUF calculated the total number of moves that taxpayers made to a state with a better or worse State-Local Tax Burden rank, and the amount of AGI associated with each. Table 8 shows the results.
Table 8: Number of Taxpayers Moving to a Better or Worse Tax Situation in 2020
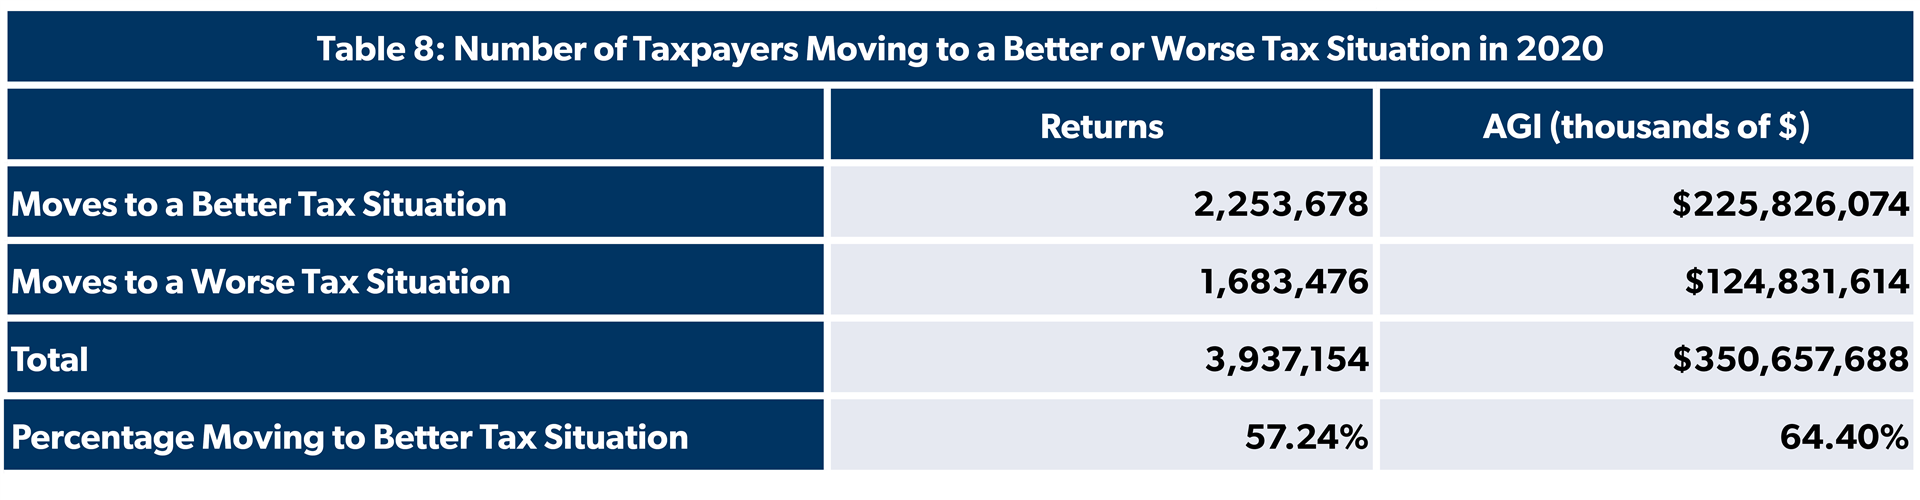
At the same time, taxes can be expected to be a less significant factor when the difference between tax situations is marginal. To account for this, NTUF looked at what we will refer to here as “tax-significant moves,” where the difference between states’ tax burden ranks is 15 or more.
Filtering out moves that are not tax-significant removes about 45 percent of moves. Of the remainder, an even greater percentage of moves went to better tax situations — a difference that is again more pronounced for AGI.
Table 9: Number of Tax-Significant Moves to a Better or Worse Tax Situation in 2020
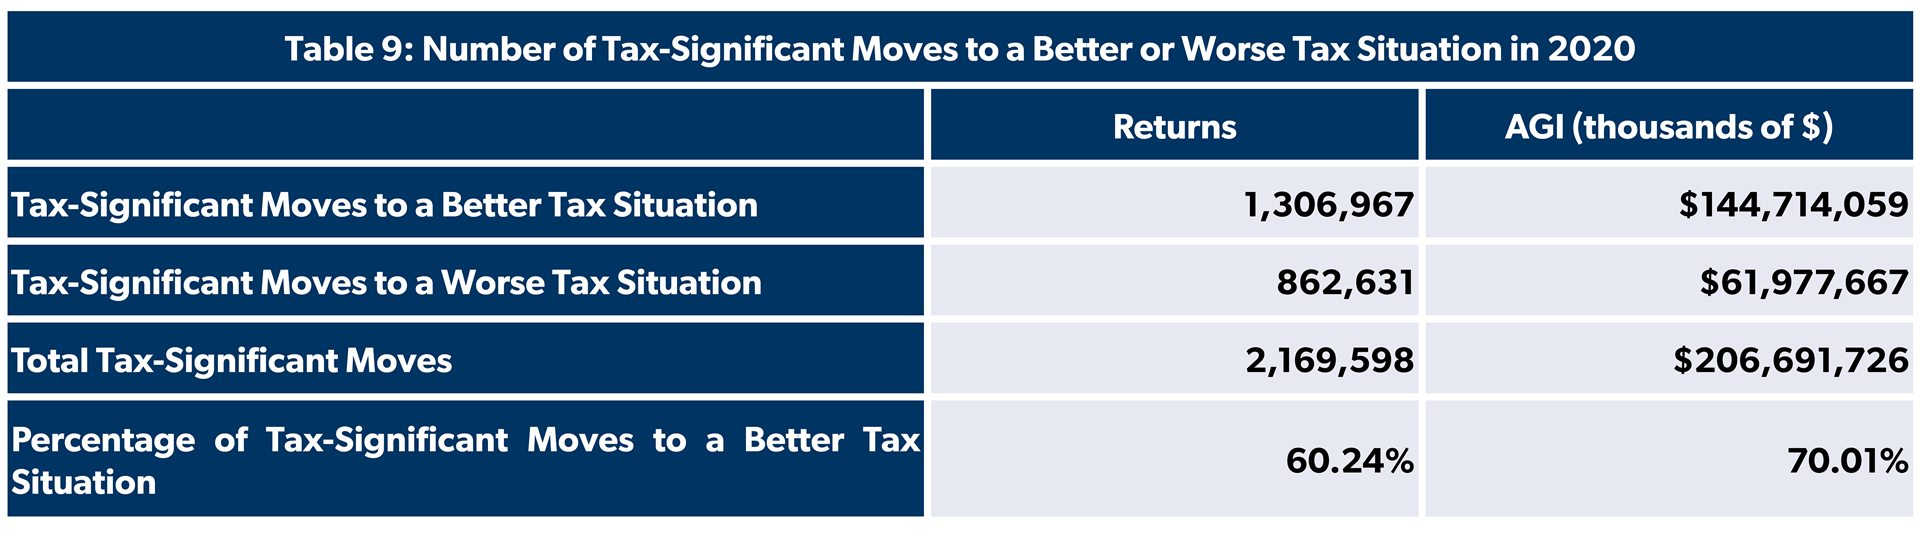
Given the multitude of reasons why taxpayers choose to move, it’s significant that majorities are moving to better tax situations. It is also clear that taxes are more important to higher-income taxpayers, with a higher percentage of AGI moving to better tax situations than households.
Other factors, while important, are less convincing. Cost of living certainly matters to Americans, and states like California, New York, and Massachusetts are indeed expensive to live in. But states like Texas and Florida also consistently rank as having higher costs of living than the average state, making it hard to explain why migrating taxpayers find these states to be such attractive destinations if cost of living is the primary determinant of taxpayer moves.
The same is true for the cost of housing, a frequent source of blame for states losing taxpayers. Once again, while this explanation seems to make sense for states like California and New York, it still fails to explain the attractiveness of Florida and Texas, where housing prices were middling in 2020 and certainly nowhere near as inexpensive as a state like West Virginia, which does not even appear on the list of top proportional tax migration winners. Meanwhile, Illinois, which lost the third-most from tax migration in 2020, had a median home price that was comparable to Florida and Texas.
Yet another factor commonly cited as being explanatory is weather. Once again, it initially appears to be explanatory — Texas and Florida certainly are warmer than New York and Massachusetts. But on the other hand, California is hardly lacking in beaches and natural beauty.
None of this is to say that these factors are irrelevant, they are of course factors for Americans in deciding residence, and may even be the primary factors in some cases. But at the aggregate level, taxpayers do seem to find taxes to be the single most important determining factor in where they live.
How Will Net Loss States Respond?
States like California, New York, Illinois, Massachusetts, New Jersey, and others that have been losing ever-greater amounts of net taxpayers, income, and tax revenue to outward tax migration could respond to this growing trend by making their tax codes more competitive. Indeed, 43 states have cut taxes in recent years, including 21 states which cut income tax rates.
Unfortunately, we have seen them respond to net outflow of people and dollars by expanding the scope of their tax authority beyond their state borders: in essence, reaching across state lines to extend their tax jurisdiction to nonresident (or formerly resident) taxpayers. Such efforts include state "economic nexus" for sales taxes, business income taxes, taxes on remote workers, and special taxes on digital commerce.
This, as much as any abstract commitment to rule of law and jurisdictional boundaries, is what makes it important that states are prevented from reaching across their borders to tax and regulate nonresidents. In violating a foundational principle of the country, the idea that elected representatives are answerable to those whom they tax and regulate via the voting booth, states are nullifying another: the federalist principle that Americans have the power to choose which state’s policies they wish to live under.
Without clear delineation of where states’ authority begins and ends, there is every incentive for states hemorrhaging tax revenue to seek to reach across their borders. As more states create overlapping rules and regulations, taxpayers will face increased complexity and further inability to influence the lawmaking process that affects them.
Conclusion
The economy today already looks different than it did three years ago, and many of the changes the pandemic brought are here to stay. They can result in more freedom of movement and choice for taxpayers, with taxes becoming even more important to taxpayers in 2020 as they were freed from the necessity of residing within commuting distance of a physical office.
On the other hand, the increasing interconnectedness of the economy presents chances for states to manufacture excuses to tax nonresidents who cannot punish them at the voting booth or escape their tax webs by moving. NTUF’s Interstate Commerce Initiative exists in large part to encourage Congress to exercise its constitutional role as a referee, ensuring that states do not harm the broader economy by exporting their tax burdens to nonresidents.
Instead, states losing taxpayers and tax revenue to domestic migration should endeavor to stem the tide of outgoing taxpayers by updating their tax codes to be less burdensome and more competitive. Taxes matter to taxpayers, and it’s time that states start recognizing that fact.
1 Most individual income tax returns are filed the year before the actual returns are followed. Individual income tax returns filed in 2020 cover tax year 2019 information, while returns filed in 2021 cover tax year 2020 information. Consequently, the current batch of data covers the change in taxpayers’ residency between 2019 and 2020.