

(pdf)
Last month, the White House boasted that the relatively smaller deficit at the close of Fiscal Year 2022 was the “largest one-year drop in American history,” implying that the Biden administration’s policies had something to do with that. The Congressional Budget Office’s (CBO) new budget summary for Fiscal Year 2022 sets the record straight that nearly all of the deficit reduction was the end of the COVID-related spending splurge enacted since 2020.
While it is undeniably true that the FY 2022 deficit fell by a record amount relative to FY 2021, this was only after deficits had been driven up to record levels. Moreover, the drop was not due to any conscious decision to get the budget under control, but was rather the natural result of pandemic spending programs winding down.
Biden sought to make the deficit significantly worse by shifting at least $426 billion in loan forgiveness debt from student borrowers onto the backs of taxpayers. CBO cannot currently calculate the ultimate price tag for the loan forgiveness until the details of the income-driven repayment plan component is finalized. And worse deficits are on the horizon according to CBO’s long-term budget outlook.
Deficits Down from Previous Two Years, But Still Much Larger than Pre-Pandemic Levels
FY 2022 ended on September 30 with a federal budget deficit of $1.4 trillion. On the positive side, this was a much better position than FY 2020’s $3.1 trillion and FY 2021’s $2.8 trillion deficit levels. On the other hand, the government’s fiscal position is worse off than before the pandemic.
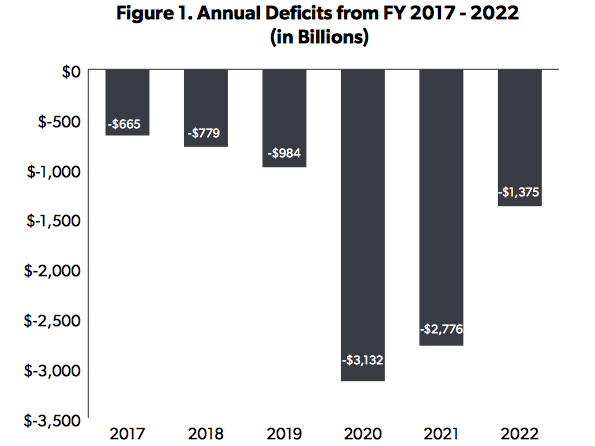
CBO reported a deficit of $984 billion for 2019, 4.6 percent of GDP. This year’s $1.4 trillion deficit totals 5.5 percent of GDP.
The last budget outlook from CBO before the pandemic was published in January 2020. In that report, the highest projected deficit total as a share of GDP was 5.4 percent in FY 2030 at the tail end of the 10-year budget projection.
In FY 2019, publicly-held debt stood at $16.8 trillion, 79.2 percent of GDP.
In the January 2020 budget outlook, CBO projected that public debt would rise to $20.1 trillion in 2022, 83.9 percent of GDP.
At the end of FY 2022, the actual debt level was $24.3 trillion, 95 percent of the Bureau of Economic Analysis’s preliminary GDP estimate for the fiscal year.
Deficits During the Pandemic
Federal government revenues shrank in 2020 as a result of reduced economic activity, falling from $3.46 trillion in 2019 to $3.42 trillion in 2020. However, they quickly rebounded. In 2021, revenues reached $4.05 trillion, the highest nominal amount ever, and 17.9 percent of GDP, the third highest level recorded this century. CBO notes that individual income tax revenues reached a historic high of 10.5 percent of GDP in 2022, compared to a fifty-year average of 8 percent of GDP.
However, the largest impact on deficits was the spending enacted in response to the pandemic and the economic shutdown. The Congressional Research Service notes that there were six laws that provided funds for pandemic relief programs including the Coronavirus Preparedness and Response Supplemental Appropriations Act, 2020, the Families First Coronavirus Response Act, the Coronavirus Aid, Relief, and Economic Security (CARES) Act, the Paycheck Protection Program and Health Care Enhancement Act, the Coronavirus Response and Relief Supplemental Appropriations Act, 2021, and the American Rescue Plan Act of 2021.
According to an estimate from the Pandemic Response Accountability Committee, an oversight board established in the CARES Act, these laws provided $5.2 trillion for pandemic spending, of which $4.35 trillion has been obligated.
In total, CBO broke out details of four major categories of pandemic-related spending that resulted in combined outlays of $3.8 trillion from 2020 through 2022:
Refundable Credits: $1.483 trillion. This includes the recovery rebates, also known as the economic impact payments, and outlays for the child tax credit and the premium tax credit.
Small Business Administration: $923 billion. The bulk of this funding supported the Paycheck Protection Program
Unemployment Compensation: $895 billion. The CARES Act provided an enhanced unemployment benefit that expired in September 2021.
Coronavirus Relief: $498 billion. This was funding provided to state and local governments.
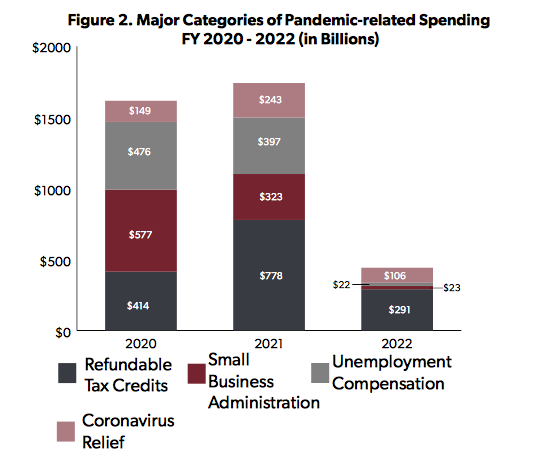
In 2020, these programs totaled $1.6 trillion which made up over half of the total deficit that year. This pandemic spending increased to $1.7 trillion in 2021 comprising nearly two-thirds of that year’s deficit. As some programs began to wind down, these outlays dropped to $442 billion in 2022, one-third of the deficit.
Student Loan Forgiveness’s Deficit Impact
The deficit for FY 2022 was $339 billion larger that CBO had estimated in the budget outlook it published in May 2022. The increase was primarily the result of the cost of Biden’s loan forgiveness plan announced in August which added $426 billion to the deficit. Under the Fair Credit Reform Act, the cost of debt relief is recorded in the immediate budget on a present-value basis. The cost of the loan relief could rise once the details of the income-driven repayment component of the plan are finalized. On the other hand, taxpayers could potentially be spared from the additional debt burden depending on the outcome of court challenges against the legality of the executive order.
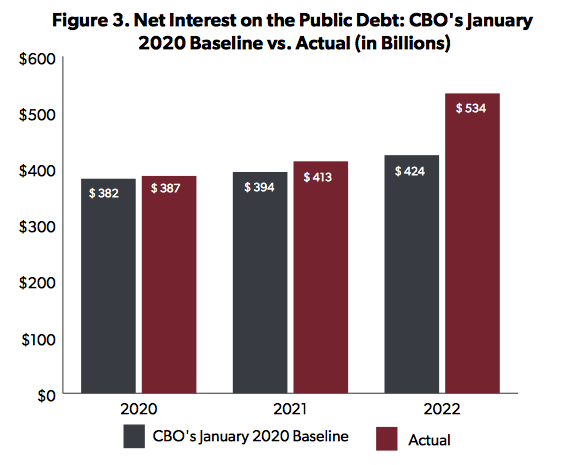
Debt Interest Payments Rise Due to Inflation
Debt interest payments are also higher relative to CBO’s pre-pandemic projection in January 2020. CBO had foreseen debt costs of $424 billion for 2022, but actual amounts were $110 billion higher at $534 billion. Interest payments soared by 29 percent from 2021 levels due to inflation and higher interest rates.
Conclusion
Instead of a toxic mix of annual deficit spending, job killing taxes, and the blunt force of a supersized Internal Revenue Service tax enforcement division, taxpayers deserve a healthy dose of pro-growth policies and budget reform.