

(pdf)
Introduction
After House passage of the Build Back Better (BBB) reconciliation package, many news reports are repeating dubious claims that it will not add to the deficit. They are also downplaying the massive bill's impact on the budget by pointing out that the spending is spread out over ten years and is “paid for” with some higher taxes. For example, a CBS News article quotes Moody's Investors Service Vice President William Foster as saying the legislation “is not supposed to have a material impact on the deficit. That results in a more balanced impact on the economy.” 1
That is a naive way of understanding the bill.
It is technically true that on paper, the bill is not intended to have an impact on the deficit, but in reality, it is not at all balanced. Though President Biden had insisted that the package was fully paid for, the Congressional Budget Office (CBO) found that despite all of the various gimmicks employed to obscure the true cost of the bill, it would nevertheless add $160 billion to the deficit over the next decade. This figure includes CBO’s estimate of new revenues from tax enforcement.
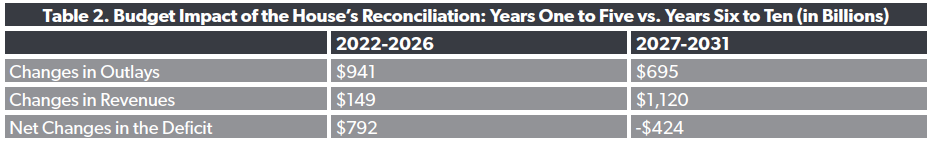
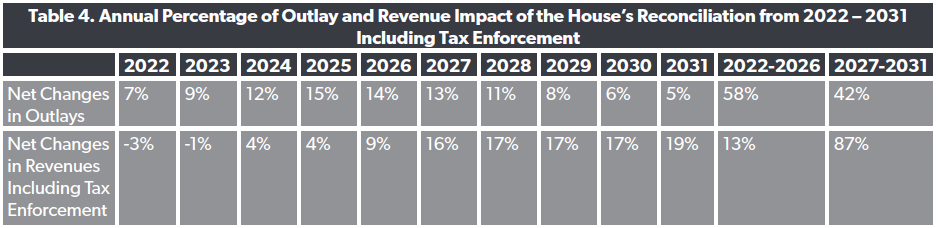
Moreover, the year-to-year impacts are completely out of balance. The spending is heavily front loaded, with 58 percent of the outlays expected to occur in the first five years, while 87 percent of the revenues from the new tax hikes would come in the back half of the BBB's ten-year budget window. This means that over the first five years, the BBB would add $750 billion to the deficit. In other words, it will require ten years of revenues to pay for a spike in spending over the first few years. This backloading of the “pay fors” increases the level of uncertainty that actual outcomes will match the estimate.
The deficit impact would be even worse than CBO’s estimate taking into account the various timing and other gimmicks drafted into the bill to help produce a more favorable score. Plus, even if the BBB were to become law, many of the tax proposals are controversial and complicated and may end up getting repealed or scaled back before they start to take their toll on taxpayers.
Breaking Down the CBO Score Year-to-Year
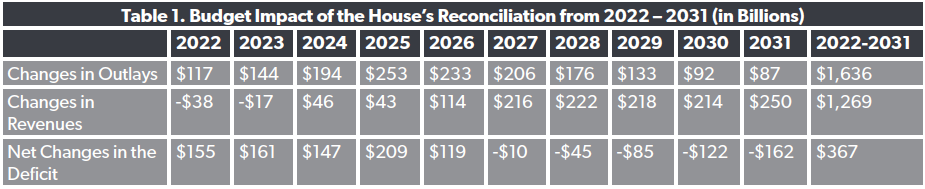
Tables 1 and 2 below show the total outlays and revenues as reported by CBO in its score of the House reconciliation package, H.R. 5367, known as the Build Back Better Act. The official score finds that the bill would lead to a deficit shortfall of $792 billion over the first five years. This also includes a net $55 billion reduction in revenues over the first two years. The biggest tax cut over the first two years results from lifting the cap on the state and local tax (SALT) deduction from $10,000 to $80,000, reducing revenues by $104 billion. The provision primarily benefits wealthy homeowners who reside in high-tax jurisdictions.
As revenues from tax hikes increase over the latter half of the decade, the net addition to the debt falls to $367 billion. The largest increase in revenues during the second half also results from the SALT change, as a lower cap kicks back in, raising $245 billion from 2027 through 2031. The cap reduction was enacted solely to gain a favorable revenue score, and the lawmakers who put it in place would likely try to again raise the cap before the reduced cap came back into effect.
Tax Enforcement in CBO’s Score
The BBB includes an $80 billion budget boost for the Internal Revenue Service (IRS) to modernize its information technology, double its workforce, and strengthen tax enforcement. This would increase tax revenues that the IRS believes would otherwise go unreported as part of the “tax gap,” or the difference between the amount of receipts the IRS actually collects versus what it believes it should be collecting.
But because of budget scoring rules, CBO cannot use these figures as part of its official estimate. These guidelines were developed to provide consistency in the budget treatment of programs across time.2 Guideline 14 of the scoring rules says, “No increase in receipts or decrease in direct spending will be scored as a result of provisions of a law that provides direct spending for administrative or program management activities.”
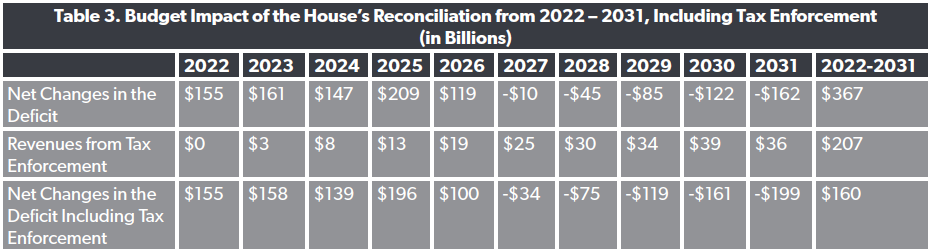
This means that uncertain savings resulting from mandatory spending increases are not counted as part of the estimate. When possible, CBO will include its estimate of the savings, but they are provided for informational purposes only. In this case CBO estimated that the new spending on tax enforcement will increase tax revenues by $207 billion over the decade. These revenues are also back loaded with just $43 billion (21 percent of the total) flowing to the Treasury over the first five years. Including that total with the official estimate reduces the net deficit impact to $160 billion.
Uncertainty in the Out Years
This analysis takes the CBO figures at face value, and also reflects CBO’s estimate of tax enforcement, demonstrating that the BBB would add to the deficit. Worse, the spending is front loaded while the tax hikes come much later in the decade. Estimates in the second half of the decade come with increased uncertainty given the potential for changes in policy. This could result from administrative actions that result in policies being implemented differently that CBO assumes. Or, Congress could enact changes in policy that would alter future budgetary outcomes of the proposals in the BBB. And even if the policies were implemented as enacted, there could be unexpected changes in the economic outlook that could significantly impact the level of actual tax receipts versus what was estimated.
In a review of the accuracy of its past revenue projections, CBO noted that it tended to overestimate the first budget year of revenues by 1.3 percent. But looking out further, the error rate grows.3 CBO reported that its 6th year had an average error rate of 5.6 percent.
Conclusion
The ultimate deficit impact of the BBB would likely be even higher than CBO’s estimate after accounting for the timing tricks used for the SALT deduction and the temporary expansion of programs that many lawmakers would like to make permanent. The Penn Wharton Budget Model, which tends to track relatively closely to CBO’s official scores, estimates that the ultimate cost of the bill would reach $4 trillion if these programs are made permanent.
There are also other gimmicks. For example, CBO estimates that prohibiting a safe harbor rule related to prescription drug rebates would reduce outlays by $143 billion. But the rule never actually went into effect. In fact, the Bipartisan Infrastructure Framework enacted just a few weeks ago further delayed the provision from taking effect before the BBB repealed. Through these budget tricks, lawmakers were able to use the savings on paper for both bills.
Taxpayers should be wary of massive spending bills that politicians and naive analysts say are fully paid for. They rarely come out that way when the proposals on paper meet reality.
1 Picchi, Amee. “Biden’s Build Back Better Act Would Have Muted Impact on Inflation, Moody’s Says.” CBS News, November, 23, 2021. Retrieved from https://www.cbsnews.com/news/inflation-infrastructure-build-back-better-biden-spending-bills.
2 Congressional Budget Office. (2021). CBO Explains Budgetary Scorekeeping Guidelines. Retrieved from: https://www.cbo.gov/system/files/2021-01/56507-Scorekeeping.pdf.
3 Congressional Budget Office. (2020.) An Evaluation of CBO’s Past Revenue Projections. Retrieved from: https://www.cbo.gov/publication/56499.